
Publisher's Note: brockman_148 went in-depth on defensive coordinator statistics and created some terrific data visualizations. His time, effort, and work deserve to be featured on the front-page. Have a unique article idea or something similarly awesome you want to cook up, email sauces [at] thekeyplay dot com. — Joe
I've taken a hobby this offseason, crunching an awful lot of numbers. I owe this in part to finally completing my bachelor's degree – I have a lot more free time. And my wife analyzes data for a living, so sometimes I like to pull my little chair up to the adult table while she's working and nerd out with a pro.
After I ran the data for the Big Eleventy last winter and This Old Terrordome in the spring, I figured I scratched the itch and could wait until winter's post-season Big Eleventy sprint. Unfortunately, I developed a knee problem and I wasn't running as much, so I sat down and cracked open the internet.
This SB Nation Article — "Clemson's Brent Venables is the country's best defensive coordinator. Who's No. 2?" — irritated me, but why?
It took me a while to figure out what I don't like about SBN's take (other than its conclusion). Then I realized what bugged me. It's not a poorly written article. Rather, it's poorly titled.
Brent Venables is the hottest defensive coordinator right now. I'll buy that. Describing him as the best like it's not even close is far from accurate. However, after I calculated the data for 5 years back, I derived a list of 17 current FBS DCs. Ian Boyd's list intersects with mine. If you eliminate for lack of data/experience (Jeremy Pruitt, Lance Anderson), coaches with only recent co-DC experience (Randy Shannon and Greg Schiano) and take the top coordinators left, you end up with a list almost identical to his. Because I took exception to the exclusion of John Chavis, I ended up running numbers for these coordinators: Dave Aranda, Don Brown, Bud Foster, Pete Kwiatkowski, Brent Venables, and Chavis to see how they stack up.
My first impulse was to just start calculating numbers and see where I got with that. I got to work processing all of the Virginia Tech defensive stats year-by-year directly from HokieSports.com. In parallel, I started a game-by-game chart in Excel focused on opposing QB performance. The extent of these comparisons were largely abandoned due in part to the amount of time it took just to compile the data for one DC; and when I started to try to utilize other team sites with much less success, I realized that I was going to have to rely on multiple sources of data for comparison. I did end up with something to show for this, but I elected not to attempt to go through with this comparison for all of these DCs.

The QB data here was only run for FBS QBs with a significant contribution in the game, as I compared those statistics against the entire season statistics. FCS teams don't have season stats in this database.
Once I ran through these statistics for Bud Foster, I had a clearer idea with which data to extract and how to proceed for comparison with the rest of the DCs.
Alright, let's peel back this onion.
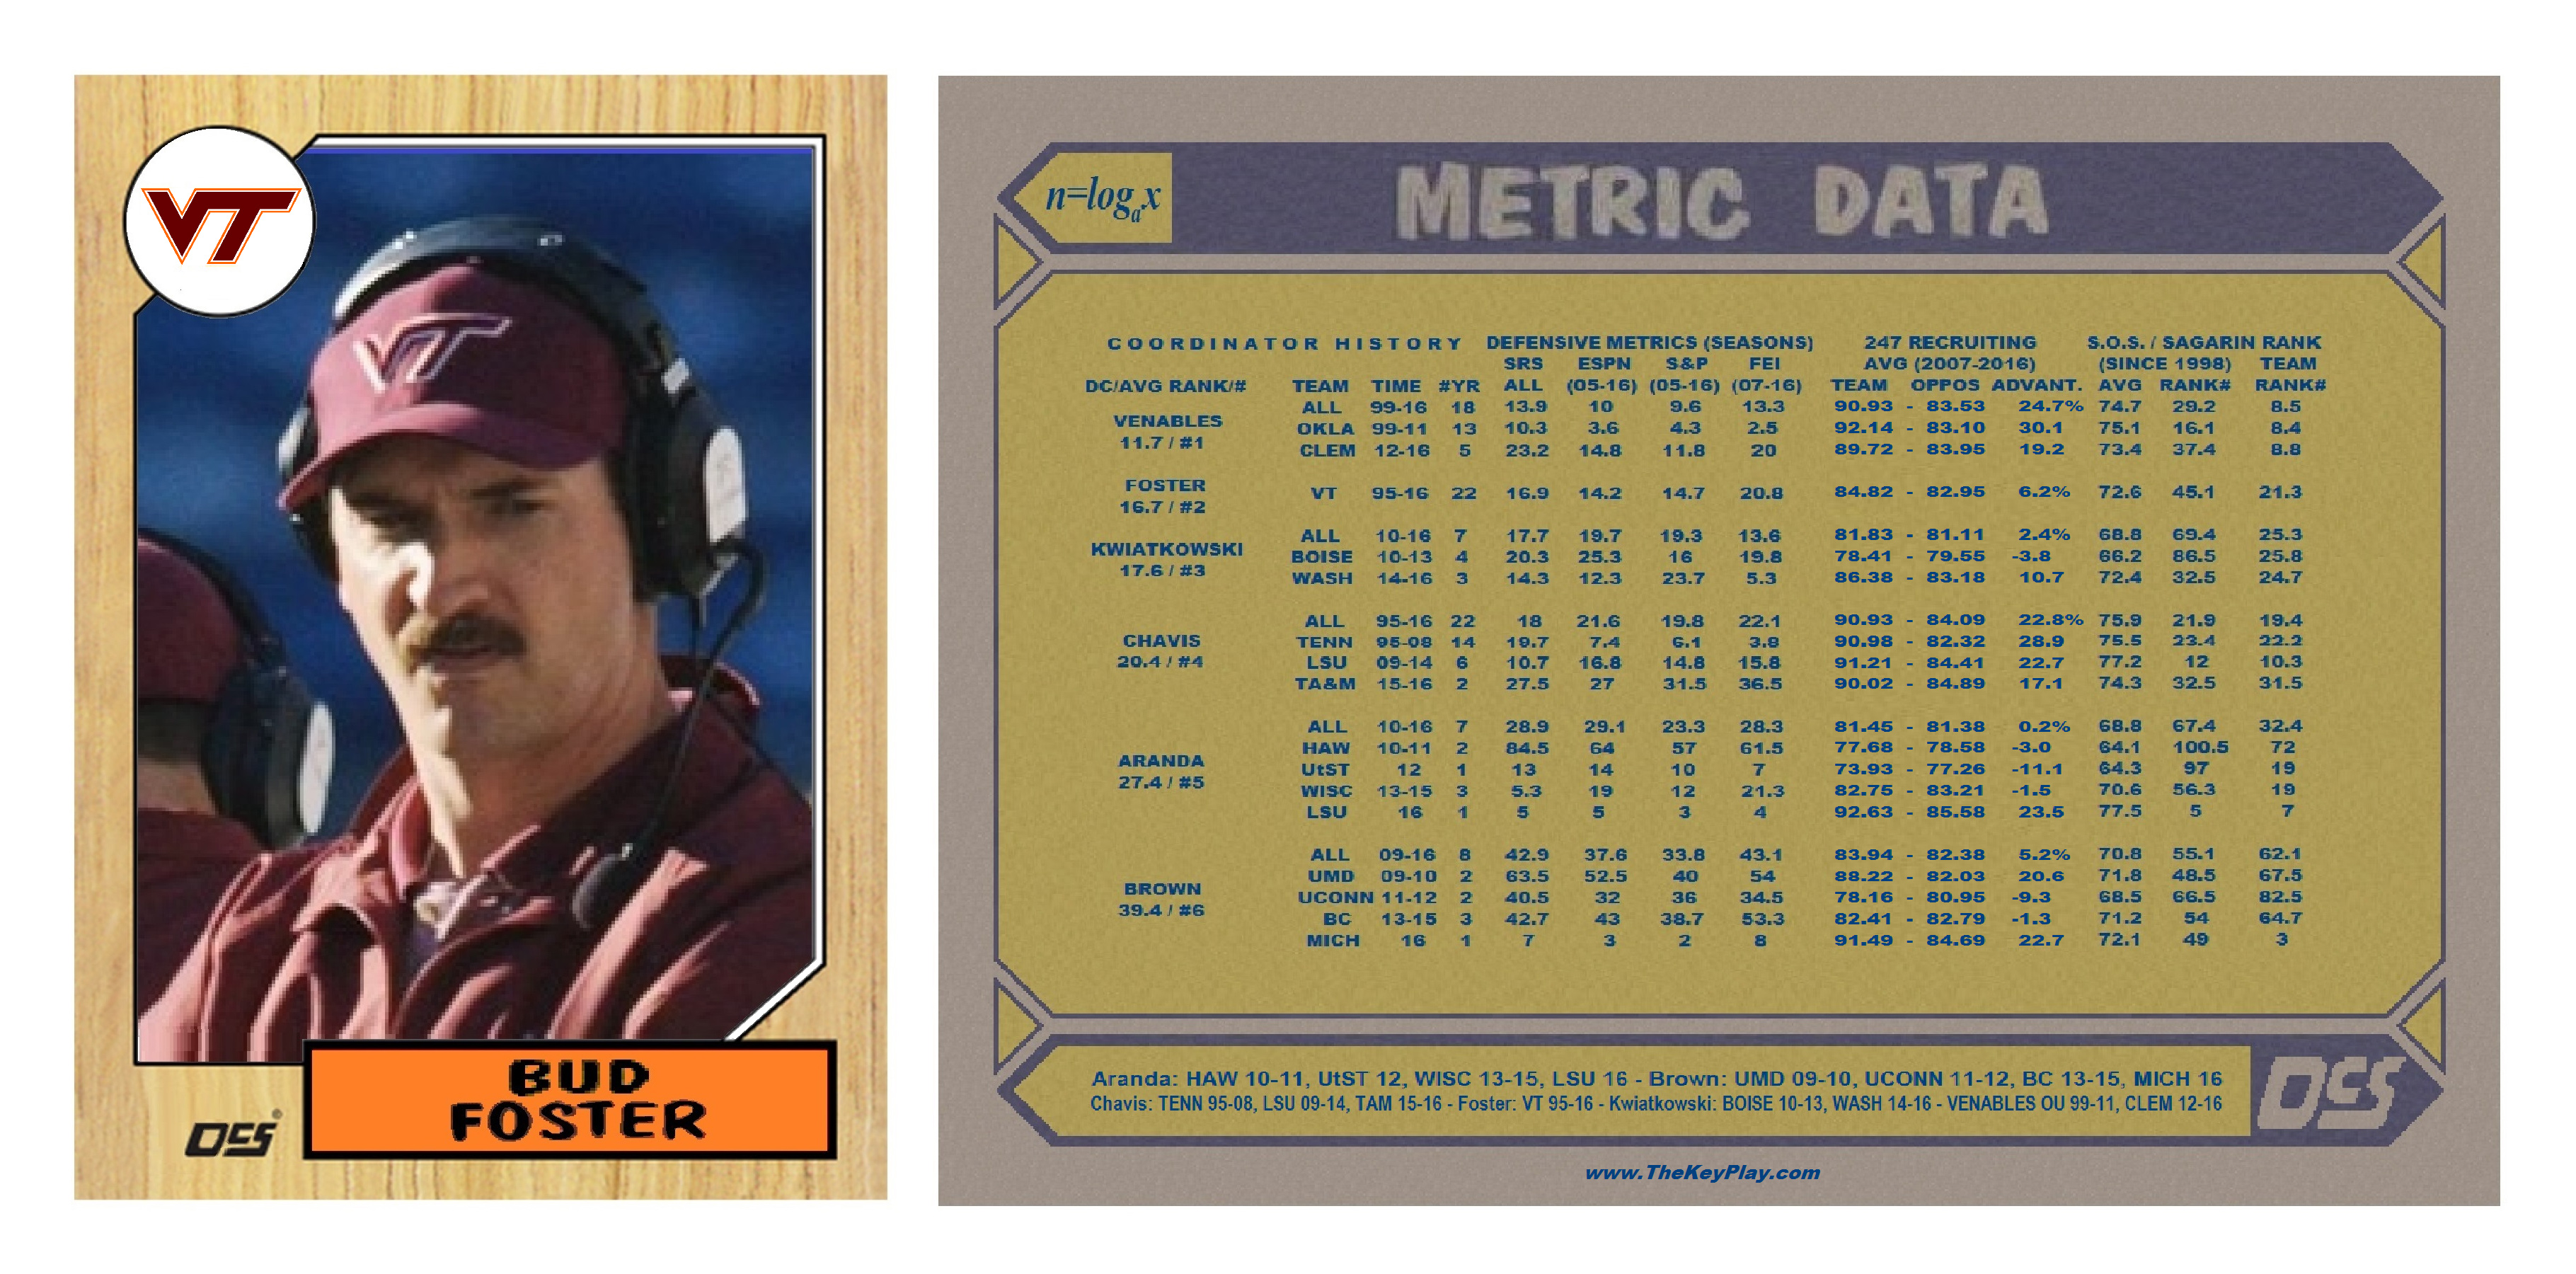
Average out the four advanced statistics (ESPN, S&P, FEI, and SRS) totals for all of these DCs and Brent Venables wins. It's not particularly close, either. Venables averages out to a rank of 11.7, Foster comes in a pretty far second at 16.7; Kwiatkowski comes in a close third at 17.6 and so on.
I used Sagarin's rankings for Strength of Schedule results. Incidentally, Brent Venables's metric advantage over Bud Foster can be attributed almost directly to Strength of Schedule. Oklahoma had a tougher run of opponents in the Big 12 than Virginia Tech in the Big East. Even now playing in the same conference, Clemson has generally played a slightly tougher schedule than VT.
It took a great amount of effort to determine recruiting input and opposition numbers, along with a Recruiting Advantage score. 247Sports has pretty complete FBS composite data starting in 2003. I used this to compute 10 years worth of numbers, back to 2007.
TEAM SCORE: If you take each of the 11 top tacklers for each season and average out their recruiting score on a tackle-weighted score, you would derive this score. Essentially, I calculated the average tackle made by recruiting ranking. This took a long time.
OPPOSITION SCORE: Well, I'm not going through 10 years of schools to do that for every opponent each DC faces every season.
No, I took a shortcut. I simply dug up every current FBS team's class data back to 2003 and performed Excel wizardry. I took each season's number of recruits and their average recruit score and made a rolling average from the current and previous four seasons. 10% to freshmen and redshirt seniors, 20% to sophomores, and 30% attributed to juniors and seniors.
I then took each coordinator's schedule and entered in the value of the expected opponent's average player by recruiting score. So it's an approximation of the level of talent the defensive coordinators were seeing from their opponents each season.
ADVANTAGE: FCS schools and walk-ons were given a minimal rating of 70.00, and so the scale was set from 70 to 100. Basically I subtracted the two averages, and multiplied them by 3.33333 to develop a "percent" advantage score.
Metrics are only valid for gauging team performance when they're skewed by strength of schedule. I figure it's kinda hard to figure how good a coach is without knowing what kind of advantage he has going against his peers.
Why did I spend so much time on this? I'm not sure, but it's something to look at and I'm proud of it. To keep to the subject, I'm not trying to engage in arguments pertaining to the importance of recruiting ability. I see a complete ineptitude to socialize and recruit as a drawback, certainly. However, there's no "ability" that supersedes location, conference affiliation, prestige, school budget, and booster support. Recruiting levels really don't change that much at any school over the 15 years I looked at (the exception was conference and division moves).
Metric comparisons are great for Pete Kwiatkowski, Dave Aranda and Don Brown. Metrics are older than their careers are. To go back beyond 2005, you have to rely on the Simple Ratings System (SRS) which uses average point differential against strength of schedule and that's all it does.

Isolate for SRS and Foster makes the competition a bit more interesting with a 13.9 – 16.9 finish behind Brent Venables.
So other than metric-ing fiercely, what else do defenses do while they're defending?
Ladies and Gentlemen, game on.

I expected John Chavis to win at least one of these categories. I'm not certain if the term "Tennessee defense" was around prior to his tenure. However, it was a statistical conundrum to account for the fact the Volunteers once had such a powerful run defense, schools wouldn't even try to run against them very much.
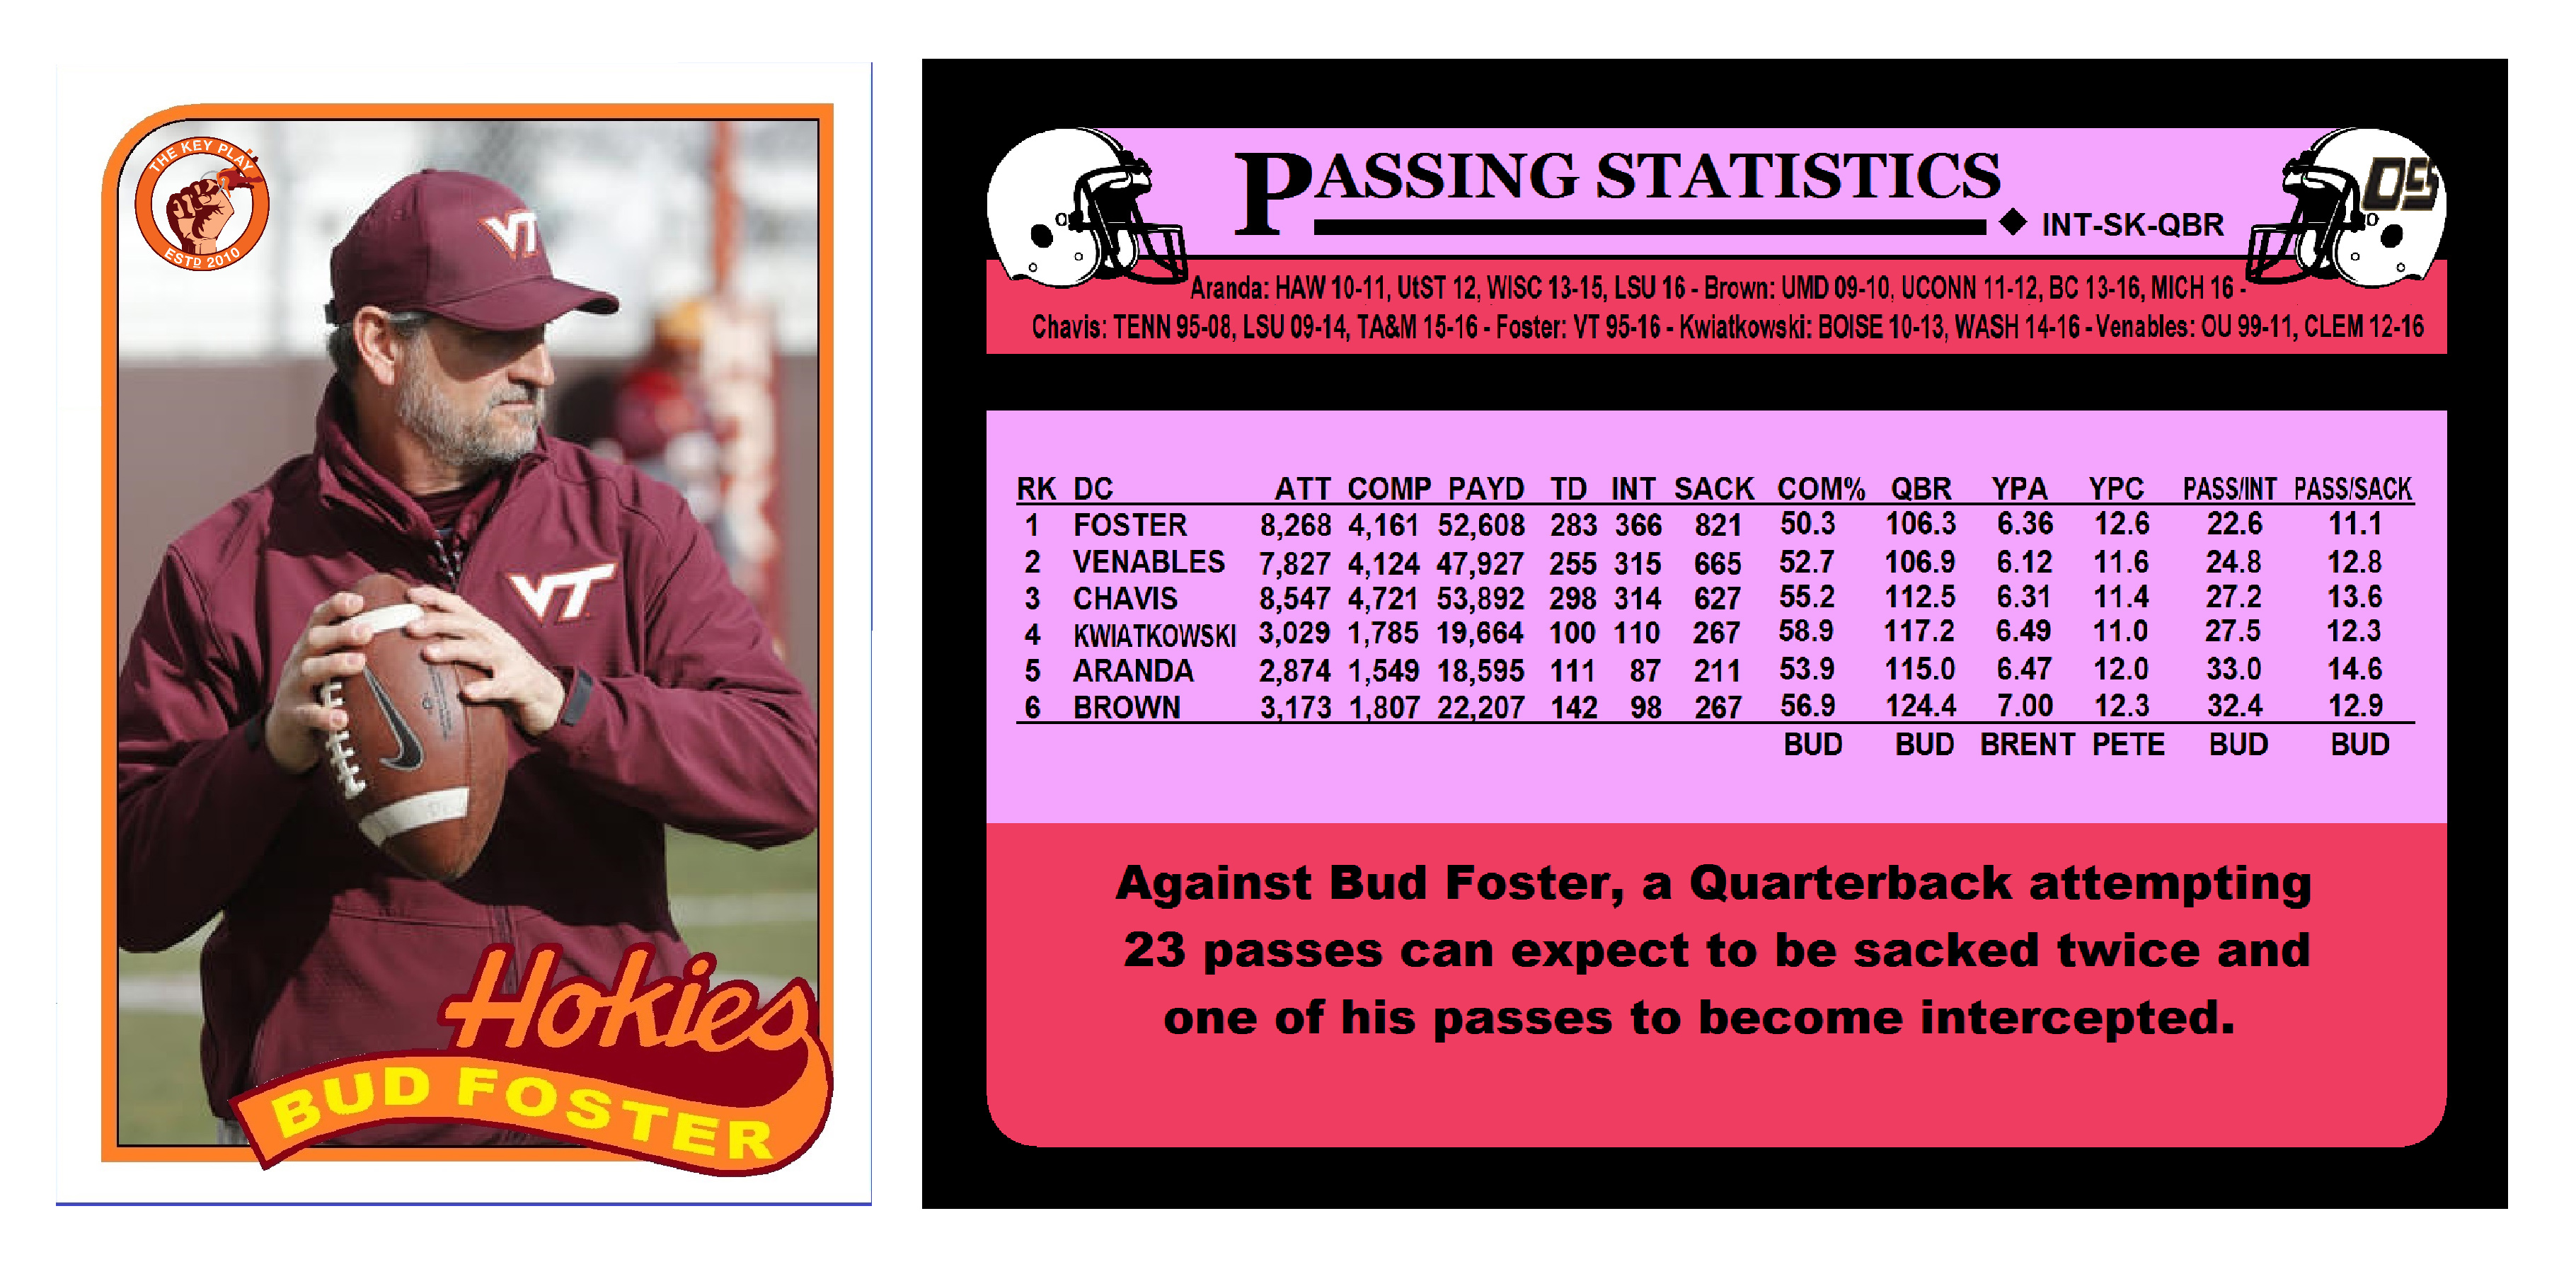
Foster manages to win the passing categories, but not without a hiccup. He typically angles towards a high risk scheme, where less passes are completed to the correct team, but those that connect typically end up as a higher reward for the offense. This wasn't as big of a blowout as the first-place finishes in completion percentage, QBR, rates of sacks and interceptions would have you think; he did finish near the bottom in both YPA and YPC.
But this isn't by accident, either. And personally, I enjoy watching sacks and interceptions.
Let's continue with a somewhat random grouping of situational statistics.

Foster manages to come in first everywhere except the red zone in these comparisons. He finishes one-tenth of a percent behind Pete Kwiatkowski in red zone scoring and third place behind Chavis and Aranda in red zone touchdowns.
Phil Steele aficionados, you'll recognize Yards per Play is listed here. Steele uses that lone statistic as its own power ranking; he tracks this list weekly during the regular season. Foster managed to edge out Venables at 4.68 - 4.70 Yards per play, with the rest of the DCs falling further behind.
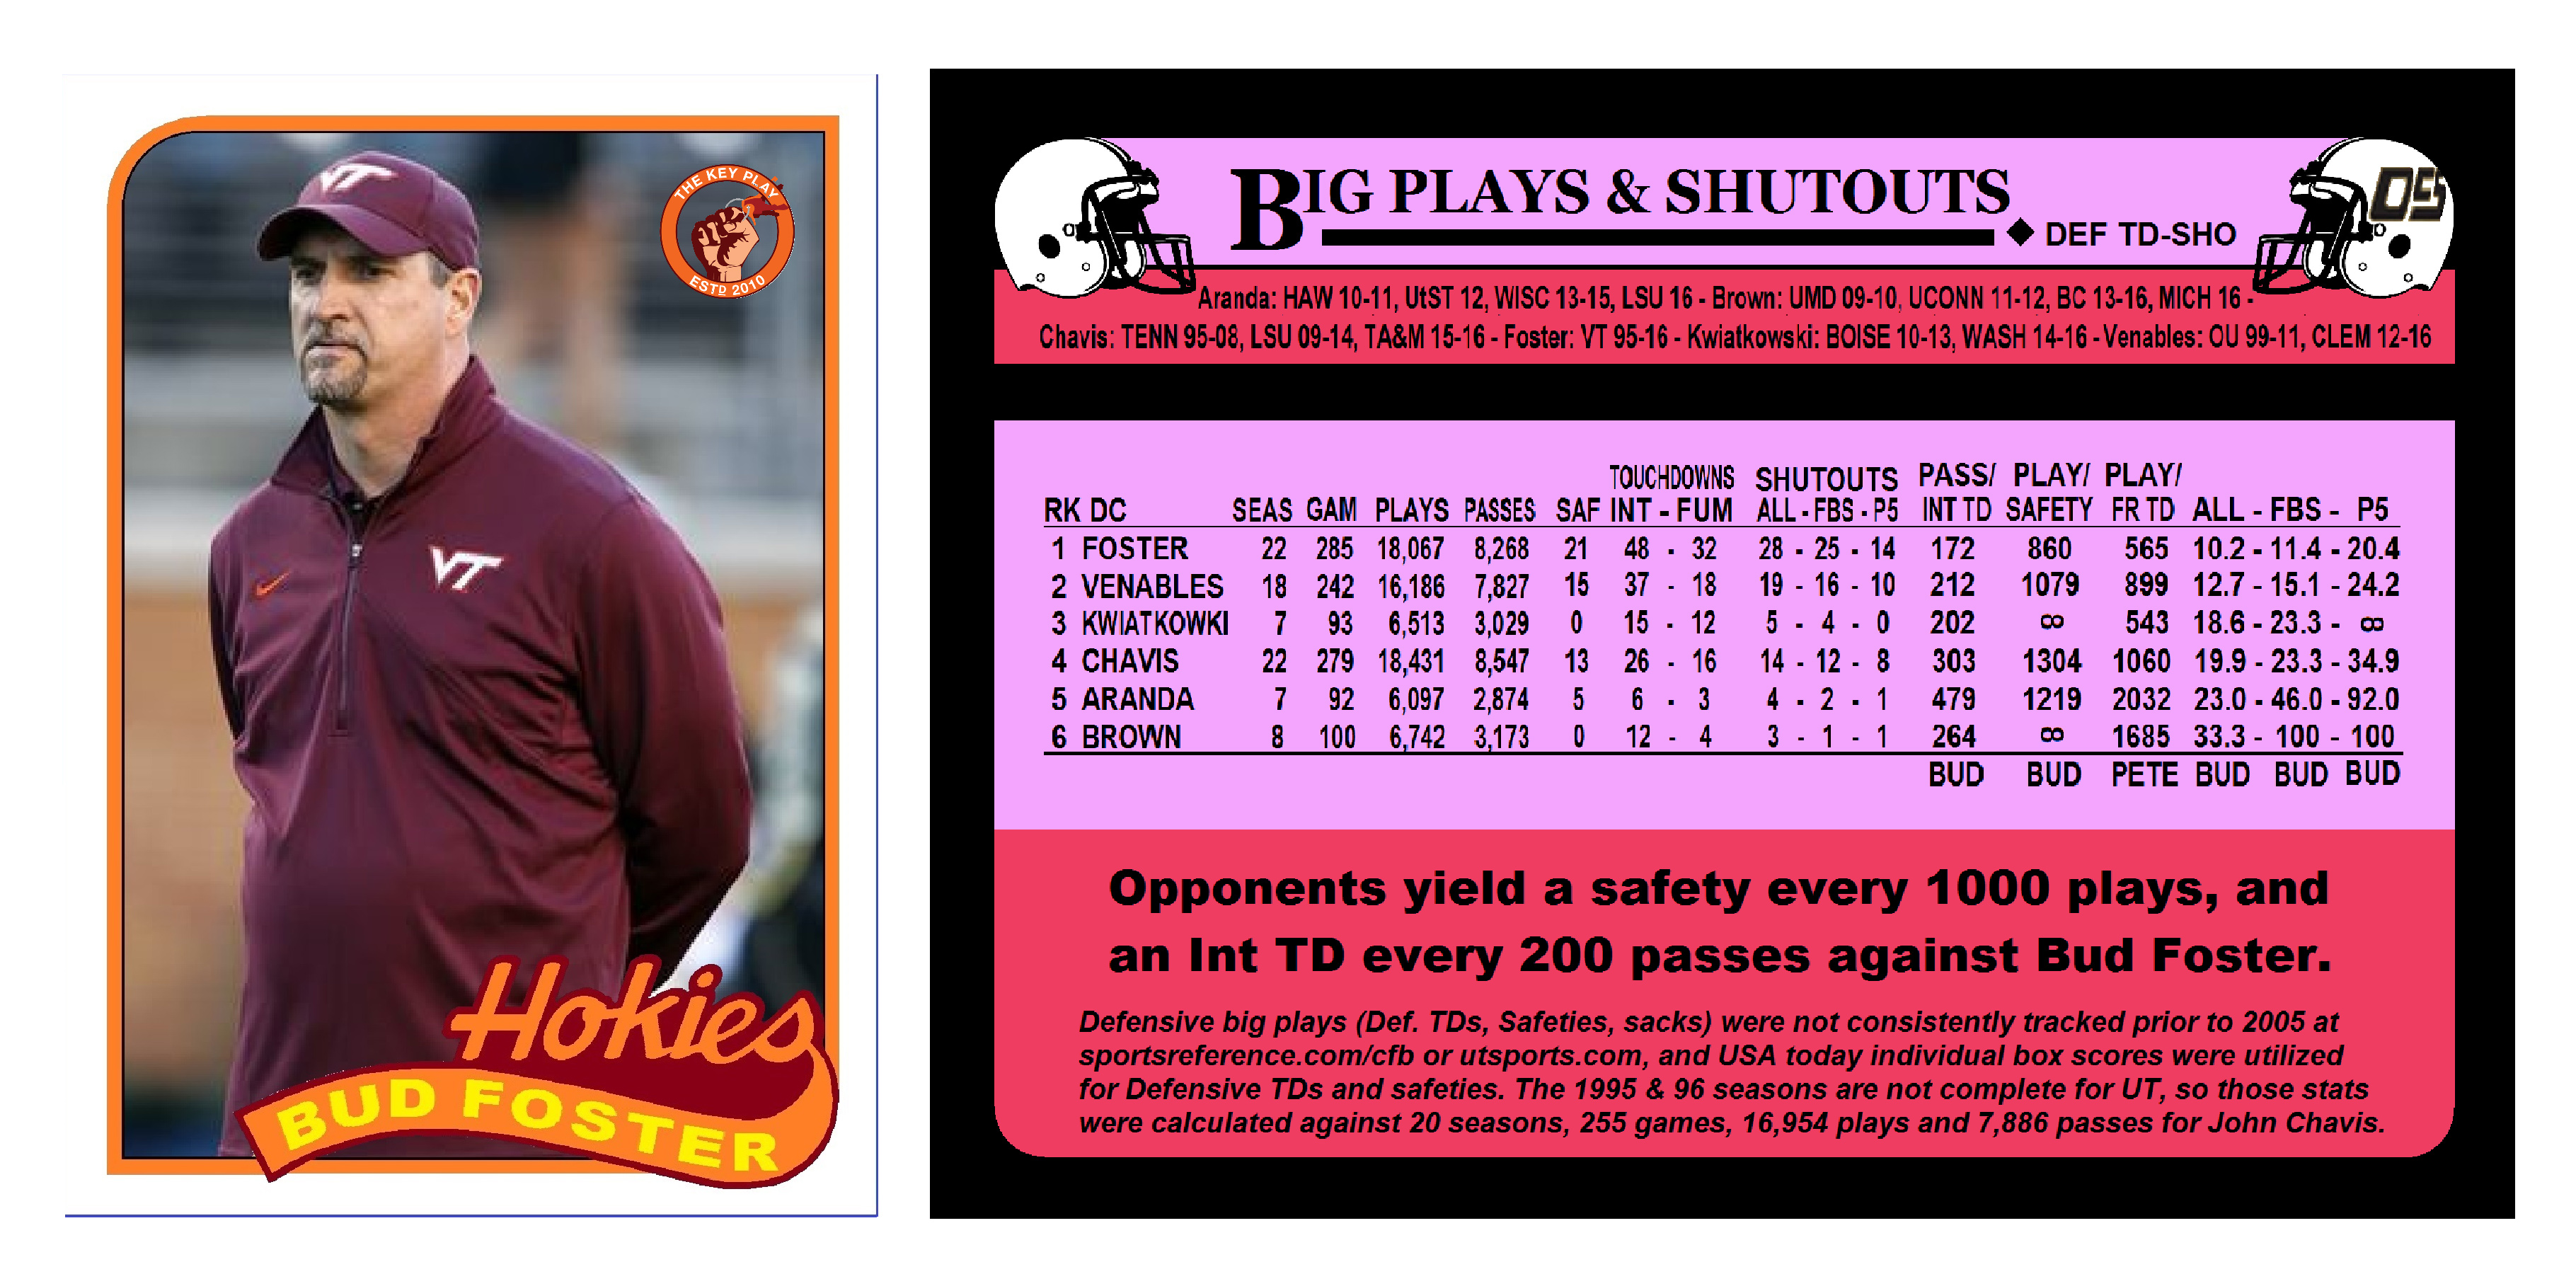
Big Plays and Shutouts. If there was any doubt who would be kicking stats and taking games on this comparison, let me be the first to introduce you to college football.
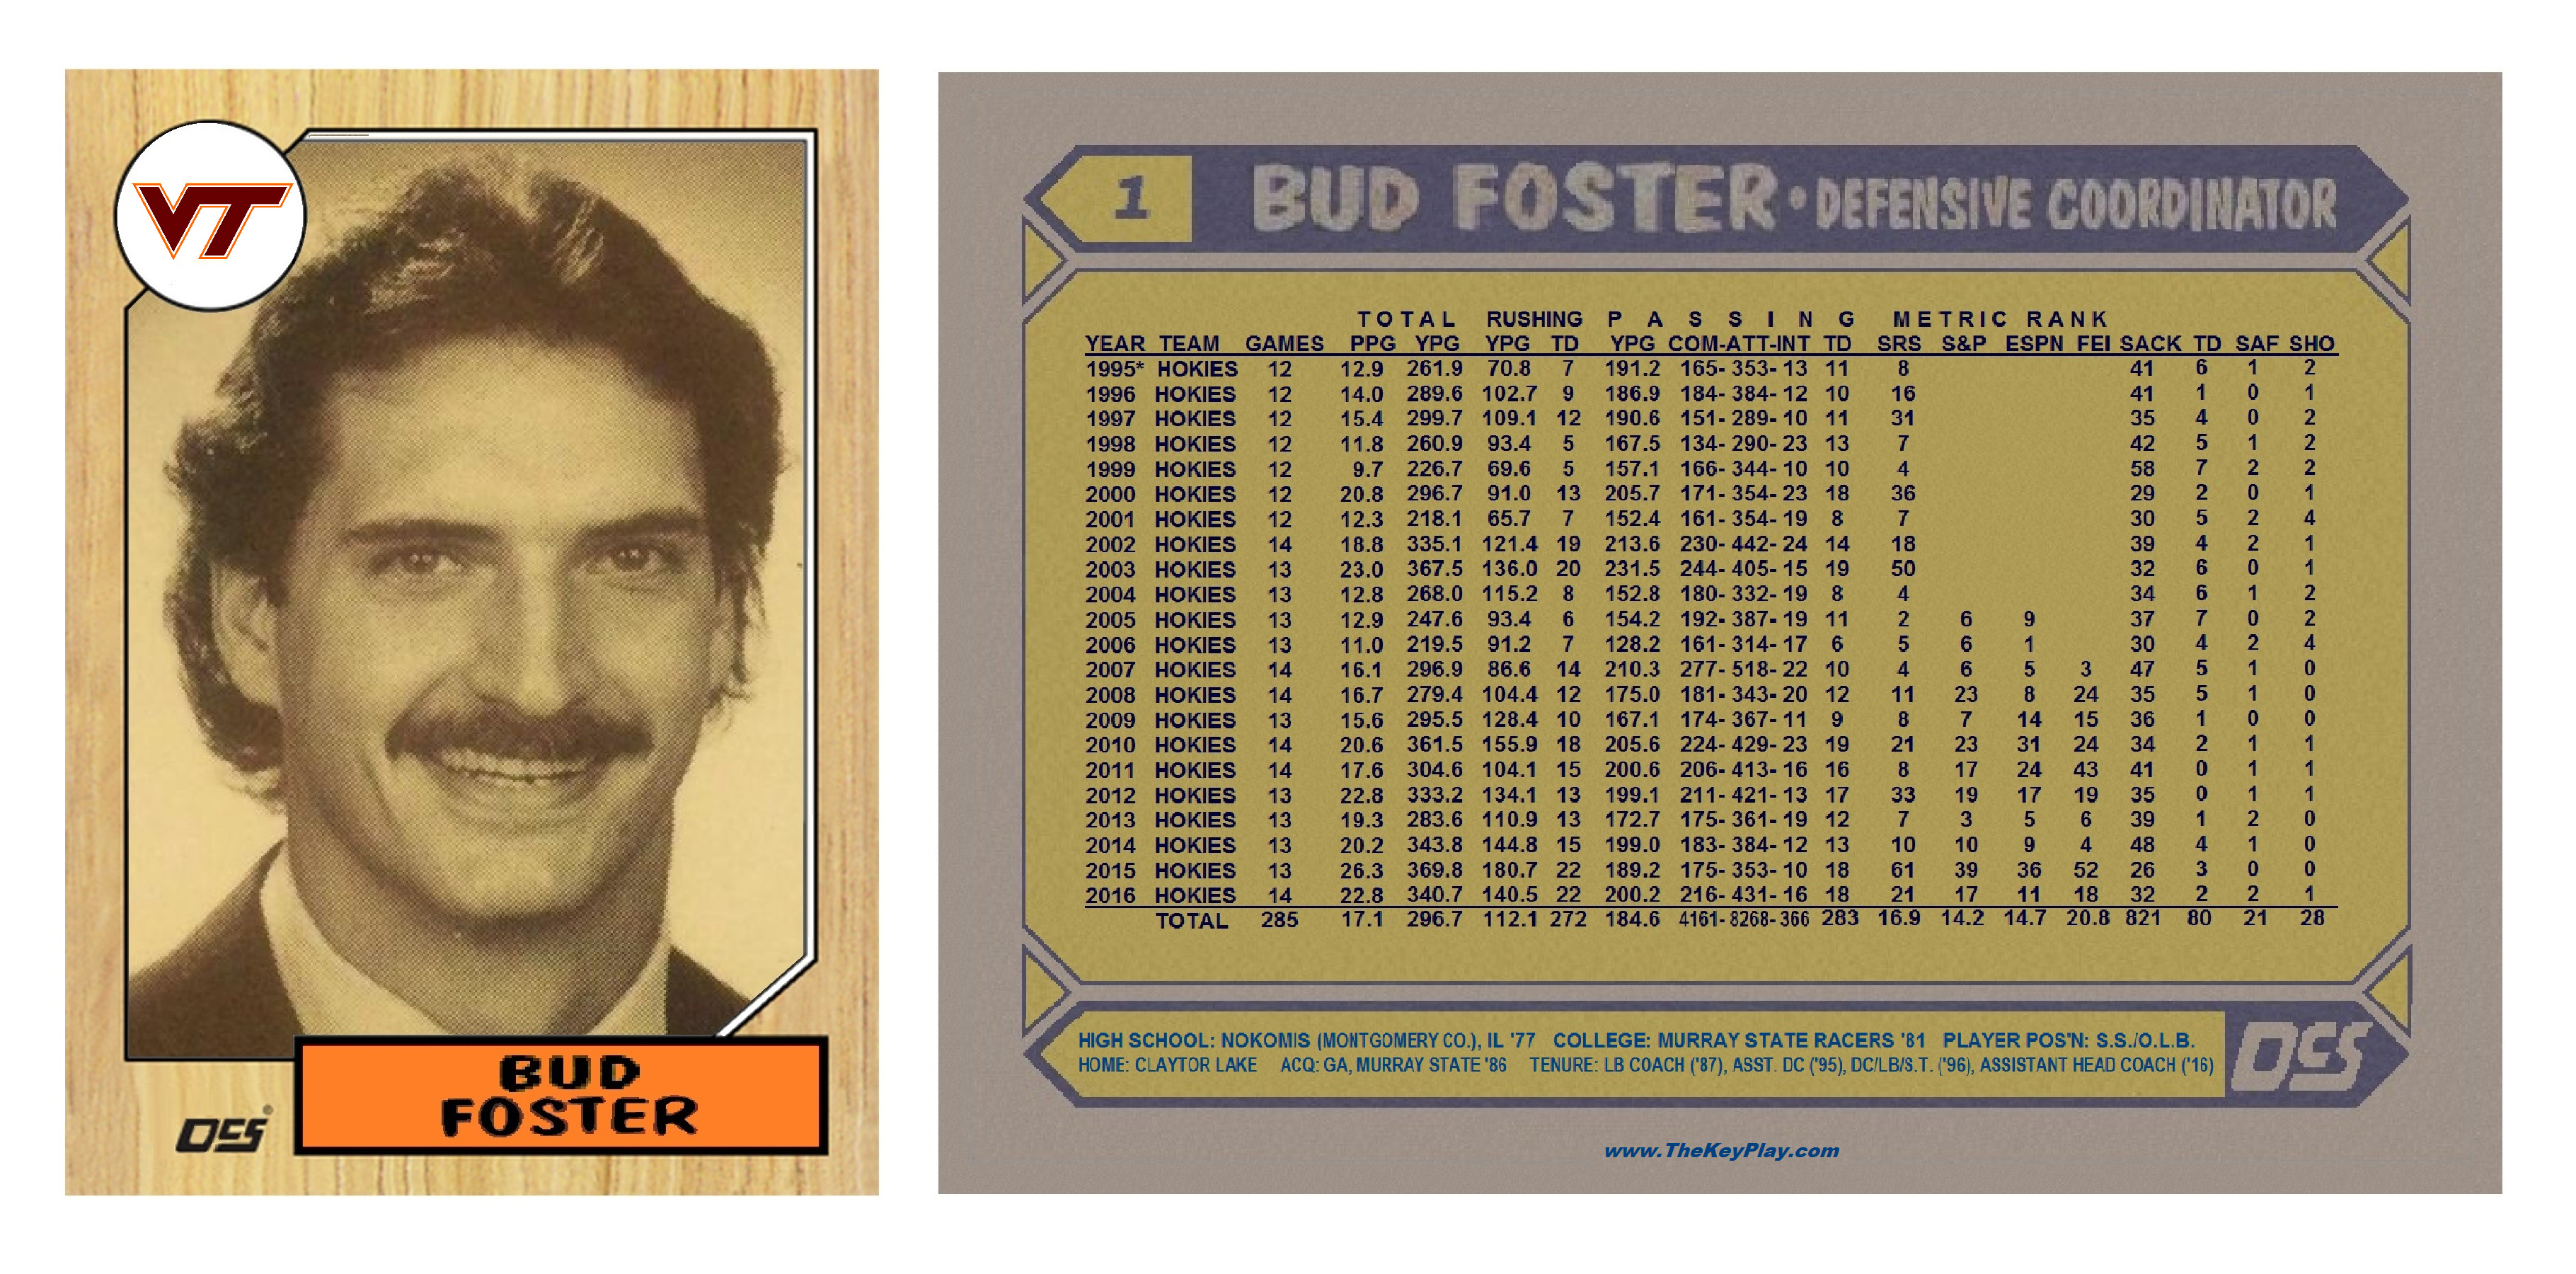
Unfortunately, defensive coordinators are prohibited by contract from issuing sentient smiles. Fortunately, Murray State has yearbooks that predate said statutes.
Who's the best of the bunch?
Brent Venables finished a season in which he hoisted the national championship trophy and won the Frank Broyles award. Of course he's the "hottest" defensive coordinator right now.
Objectively, there's not much that separates these six elite defensive coordinators. Can I make the case that Bud Foster is better than the rest of the group? Sure, but I walked into this with a bias. No matter who you back in this argument, it's realistically and statistically pretty damn close.
References
Sports-reference.com/cfb is responsible for about half of the data in this analysis. 247Sports.com, ESPN.com, cfbstats.com, footballoutsiders.com/stats, usatoday.com/sports/collegefootball, and Philsteele.com were used heavily, and/or very helpful in filling in the gaps.
Thank you HokieSports for keeping accurate season statistics all the way back to 1987! Not many college football team sites are this reliable. These sites are:
Soonersports.com, clemsontigers.com, utsports.com, lsusports.net, 12thman.com, uconnhuskies.com, bceagles.com, mgoblue.com, umterps.com, broncosports.com, gohuskies.com, utahstateaggies.com, uwbadgers.com, and hawaiiathletics.com.
Topps trading card company 1987 and 1989 baseball cards were both instrumental in my childhood and in the creation of these graphics.
Also, thank you cfb.reddit.com: the timely thread from u/DucksGoQuackQuack!, and an eloquent counterpoint, as evidenced by upvotes u/Goodmorningdave.

Comments
Great work and really interesting conclusions. Not that I didn't know this before your article, but we're lucky to have kept Bud for so long!
Thank you! I definitely agree with this sentiment.
This is really great analysis.
I would be curious to see how they rank inclusive of player star rating. No question Bud is the "does more with less" champion, but would be interesting to see by how much.
I was pretty happy when the recruiting numbers finally started to come together, but the next problem is figuring out how to weigh recruiting data. This would be similar to how SOS is factored into the metrics. I didn't get too deep into this problem, and I basically stopped with displaying the data I found next to the SOS data, but it would be really interesting to see.
Fantastic breakdown!
I saw the same article too a few months back, read the whole thing and still came away thinking that Bud got marginalized somehow.
Strength of schedule, run stats vs pass stats, recruiting rankings, etc. You put a lot of work into this and framed it up nicely with the baseball card theme.
Thank you for the analytical comparison of why we are so lucky to have Bud.
Thanks for the feedback. I'm glad you like the baseball card graphics - I started with the idea of using old Topps baseball cards with the notion that if something else better clicked I'd probably leave the baseball card idea completely. Nothing else emerged, and I'd always wanted to see the 1989 Topps font written for the Hokies, so eventually it won.
That was a very awesome touch, not sure if you have a bigger version for the first couple and if someone can format the article to allow for "click to enlarge" (maybe just my system?) but I couldn't read all the good stuff you put on the back of the cards. It would be a shame for all the number crunching to go to waste as a result of formatting.
But how many cartwheels can each of them do?
It's kind of subjective. I think I counted about 0.7

And he managed all of this despite the debilitating handicap that he prefers cake. Incredible!
FOSTER > venables
Mathematically proven by this inequality statement!
It's really not debatable outside of the sports media circle jerk. Venables had incredible talent at Oklahoma and Clemson and has had great offenses to back up his defense at both locations. His DL talent at Clemson has been shockingly absurd, and that can cover up an enormous amount of schematic weaknesses. While he does have a lot of cool designer blitzes and such, Clemson's defenses have still struggled against top offenses. They prey heavily on weak teams or teams without a strong offensive identity and put up wild numbers that skew the rest of the season. Throw in a dominant performance against an ultra-conservative Ohio State team that played directly into Clemson's strengths, and you have the perfect recipe for these narratives. Foster has changed and altered his defense many times and has alway done more with less, while often times having a horrible offense that consistently put our defense in bad positions.
:)
Sooo...summarized and proofed mathematically
venables < FOSTER
I just want to point out that part of coaching is recruiting. Not saying you don't have a point about schemes, but its a bit disingenuous to criticize Venables for doing it with more talent when he's the one recruiting a lot of it.
Yeah but how do you then qualify their abilities on the recruiting trail when one is at a program like Clemson (read: blue chip or close to it and surrounded by the top talent) and the other is at Virginia Tech? Gotta figure the former has a leg up.
Sure, Venables is a strong recruiter, but Oklahoma is one of the top 5 CFB programs of all time probably, and have been largely successful for the last 25 years. Additionally, he didn't get the ball rolling in Clemson, that would be the hire of Chad Morris that saved Dabo's job and made Clemson a hugely attractive location. Not to mention, Venables most successful statistical defense (2014) was mostly recruited by Kevin Steele. And he got in at the right time after the 2011 season which put Clemson on the map as an attractive "on the rise" program with an exciting offense which was already flocking in recruits. Clemson has been as easy sell the entire time he's been there.
This would be a valid point, except that it detracts from the argument in favor of Bud. Therefore it is specious nonsense.
I feel like I responded to the above with some legitimate points, not just bias towards Bud. Also, there is almost certainly nobody on this board who has watched as much Clemson football as I have in recent years, as I was a student there for the 2011-2014 seasons and still live in the upstate of SC and the majority of my friends are Clemson fans. I know what I'm watching when I watch a Venable's defense.
There's no reason to hide or minimize anything on Bud Foster's resume. It's pretty amazing and it speaks for itself, good or bad.
That's not how recruiting works, though.
If you think of coaches as "salesmen", that's an intuitive assumption, and it's a common enough error to make.
In reality, coaches are more like the mechanics or service staff at a school (or car dealership). You might be happy to drive a car with a competent garage, but in this analogy the schools don't even have to "sell" themselves, they pretty much give themselves away for free (i.e. A full "ride").
If you're a talented kid and "Tuscaloosa Imports" can offer you a Ferrari to drive, and Crazy Chris Peterson's Kia of Boise is offering you a Kia Sport, you go with the Ferrari. No question.
Nobody cares that Chris Peterson's Kias can race with Saban's Ferraris and perhaps could even beat them in a race.
Recruiting numbers support this. SEC teams generally hover around 86-88 with little change; other P5 conferences fall a point or two lower on average (~84-87).
Non-power-5 teams' average recruit ranking are ~77-82 with nothing higher. At Boise, Peterson spent half a decade lodged firmly in the top ten, and all they managed to do at Boise was bring the average recruit from a 78-81 over the last ten years. They managed one 4* recruit every other year and never sniffed a 5* there.
He took a job at Washington and now they're suddenly pulling in recruits in the upper 80's... Because Washington was already pulling in recruits at this level.
Step changes in recruiting don't come from the garage mechanics (coaches), they come from the salespeople and above (schools, athletic departments). Coaches can be competent, but they can't offer a kid anything better than what their dealership has on the lot.
Any kid is going to know better if the mechanic is offering him a "Ferrari" that looks an awful lot like a Honda Civic. He's going to wait until he gets to a real Ferrari dealership with real Ferraris on their lot, and he's going to accept a scholarship to drive a real Ferrari for 4 years.
Know what Kiffin's meteoric rise at FAU looks like? He's managed to take ~78 level recruits all the way up to one class that averages almost a perfect 82! The average recruit ranking there is almost up to 80. Man, he's about to turn Owl-Town Hyundai into a genuine Audi dealership. Except without a huge wave of booster support, new athletic facilities, a drive to make a P5 conference and some kind of assurance that he or somebody of his caliber will be coaching there four years from now, and a whole lot of other things way outside of Lane Kiffin's control, he's not.
Lane Kiffin is a Hyundai mechanic until FAU genuinely turns itself into a dealership with Audis. Or until somebody offers him a job at one of those nice places.
Holding coaches primarily accountable for their schools ability to entice recruits is absurd.
(Apologies for the weird analogy)
I think it is an awesome analogy!!!
Well done.
And just remember, Bud did all that without the help of even a decent offense to keep his units off the field.
Its only a matter of time before VT reminds everyone why Bud is the best. Just, this time we'll also be busy putting 40 per game on the board on offense, too.
Great as he is, and we know it, we must not draw more attention to him so other will take more note of him and possibly try to luring him away.
I'll drink to that Natty C, brother! Now that will be a fun watch. Heck, who knows, maybe Bud will be able to show his mettle against some of those other top DC's along the way to the NC.
Great read, also loved the images.
Somewhat related - I skimmed the SBNation article you linked, and saw that we had the 3rd best defense (according to S&P) in 2013... I wanted to leave yet another comment that if only Kyle Fuller stayed healthy... that was a 10 win team that could have done some damage. Oh well.
When I saw the title of the thread, I came with the intent of making a snarky remark and moving on.
Now that I've read it, I'm sitting here feeling very impressed and enlightened. Well done.
Thank you. Not every piece of data screams "Bud Foster is by far #1", but I figure if you want to make a case for something that you believe to be true, run as many numbers as you can on the subject.
The results weren't disappointing. I'll leave it to the writers and pundits to formulate their conclusions, but it's nice to have a bunch of data to come back to should I get into an argument one day.
I do not have the experience in statistics to fully appreciate this, but the article was written in a way that I could follow and understand on a hungover Monday morning. Thank you.
Super extra bonus appreciation for the great coach's card pictures and graphics. I would collect those.
great work, did you use Power BI for any of the Data Viz?
My wife wanted to teach me Stata for me when I started rolling on this, but she ended up ceding that the data I had was probably just best run in Excel. I don't have a lot of background in software of this type, so I pretty much just construct everything manually in MS Paint.
you did those cards in MS Paint!?!? Holy smokes! You deserve all-you-can-eat Lane Stadium turkey legs for that alone!
I want those cards
You rock Brock. That was some seriously good shit right there.
Awesome...incredible effort...and thank you!
Pretty cool. My son's best friend is Pete Kwiatkowski's nephew. I just sent this article to his Mom, Pete's sister
That's awesome!
You did not factor in the look:
PIMP
I just wanted to add on to the righteous praise you deserve for putting this together. The information was thought provoking, the graphics were awesome & creative and the article was well written; complete with witty verbiage worthy of TKP. All in all it was a great read. Well done!
This was excellent, and looks like that Greek elective really paid off. I really only bought the cards for the bubble gum after t-ball, but mom made sure we kept the cards.
Let's get this season underway already. I left the country a week after the national championship, and pulled in 7 months later to a bunch of awesome articles and opinion. Deployment was good for one thing, the offseason has gone by fast.
It's good to have you back! I hope you didn't get stuck with first day duty.
To catch you up, fidget spinners are still a thing, we lost Mary Tyler Moore, Chuck Berry and Jerry Lewis this year.
A computer virus was going to crash the whole internet and some guy stopped it by mistake. McDonalds is still big on this healthy food/salad kick. Yesterday's eclipse is still big news.
Can't wait to hear some of your stories!
Edit: Kurt Benkert is our new starting quarterback. Ask Fireman about that sometime.
Wait, what you say about that virus thing is legit? Do you have something I could read, that sounds interesting to say the least. I had no idea
It seems my claim of taking down the whole internet was a bit of Hyperbole but I was going from memory and trying to be brief.
Has Mark Zuckerberg completed SkyNet yet?
Well... We weren't supposed to look up when it got all dark yesterday... But Siri says no so we're probably good.
Thanks.
Best part is I don't have to hijack threads with my travel updates anymore... :|
Fun fact: some things we do and aren't supposed to talk about, the pilots still make and sell t-shirts for it. And bring their own sharpies for autographs.
Welcome back and thank you for your service!
Welcome home, Sir and thank you for your service!
Awesome work. I especially loved the 80's Topps trading card graphics. Great touch.
Fantastic post!
Great work on the data assembly and crunching. Of course we all agree with your finding of Bud Foster is the best.
I haven't even read this yet, but I LOVE LOVE LOVE the throwback Topps trading cards! Triple leg!