
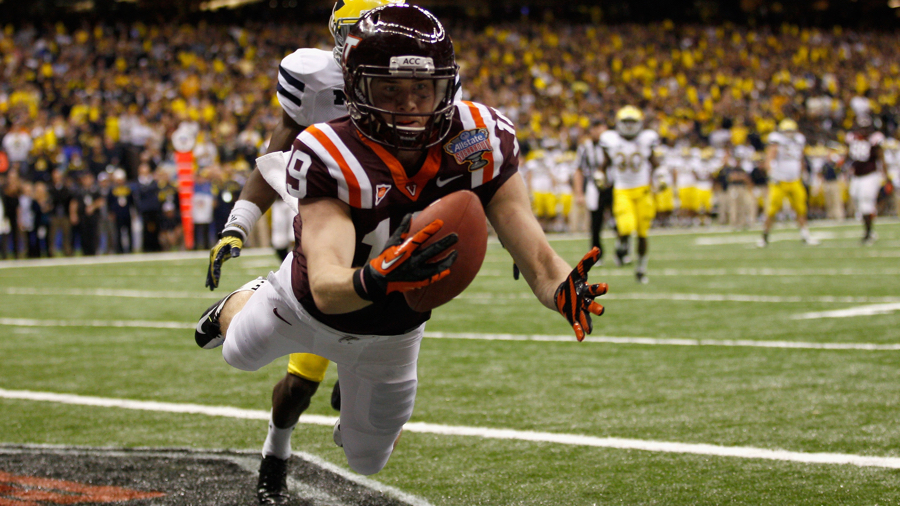
Ask any devout Hokie, "Was it a catch?", and he or she will adamantly tell you it was. You don't need to specify that it was the Sugar Bowl, or that the opponent was Michigan, or that it was overtime, or that Logan Thomas was the quarterback. And you certainly don't need to say the receiver was Danny Coale. It was an opportunity to show the nation that Virginia Tech belonged in a BCS bowl; it was a chance to tell the world that the team wouldn't yet again lose to a marquee opponent; it was a thrilling game that had the attention of every football fan in America; it was a catch.
Logan Thomas patiently waits behind strong protection from the line and unleashes a perfectly thrown pass, leading Danny Coale right as he streaks across the end zone with a step on the defender. Coale lays out and grabs the ball one-handed and crashes to the ground. Inexplicably, the replay official reverses the on-the-field call that it was a catch. The game is lost. So is the Virginia Tech offense.
The Basics
Virginia Tech's offense has been nothing short of a roller coaster for many years. Most fans associate the quality of production with its quarterback: Michael Vick, Bryan Randall, and Tyrod Taylor are remembered as part of teams that seemed to give opposing defenses fits, while Grant Noel and Sean Glennon elicit groans. Logan Thomas is an enigma. It's of course not all on the quarterback, but it's the nature of football. When times are good the quarterback gets too much credit, and when times are bad he takes too much blame.
It's futile to try to pick apart each component of the game; line play affects passing affects rushing affects play-calling affects recruiting and so on. Everything fits together like a Jenga game (ask Buzz Williams), and you can only pull so many pieces before everything comes tumbling down. Everything came tumbling down after The Catch but some pieces were missing already.
To get a handle on the state of the Hokie offense, statistics are presented from 2007-2014 (because that is the period they are available for) from several sources for which enough credit cannot be given: Football Outsiders, BCF Toys, and FBS Drive Stats. Common statistics like points per game and yards per game are insufficient, as they don't account for the quality of opponent, starting field position, the quality of one's own defense, etc... So whenever possible statistics are rate- or opponent-adjusted. Please ask any questions about specific statistics in comments.
What Happened to the Points?
The primary role of the offense in football is to score points. There may be secondary goals like controlling the clock or wearing down the defense, but each is irrelevant if the primary goal is not achieved. Since the opposing team affects how many drives the offense is given, scoring can be considered on a per-drive basis:
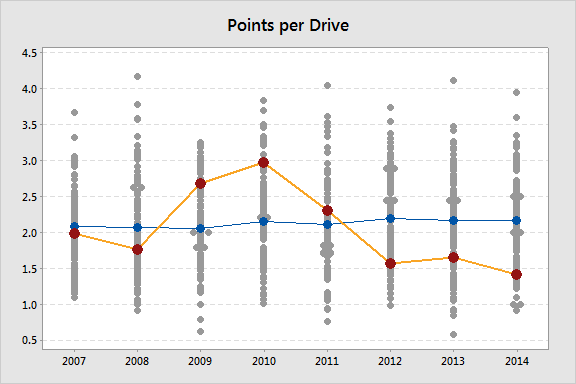
The ability to score peaked Tyrod's senior year (2010), and was already moving downhill quickly at the time of The Catch despite national average remaining fairly stable. (Note: the perceived increase in offense recently is more a function of pace than scoring ability, as many teams simply get more drives per game, but score about the same number of points on each.) The percentage of drives in which the offense scores follows the same pattern:
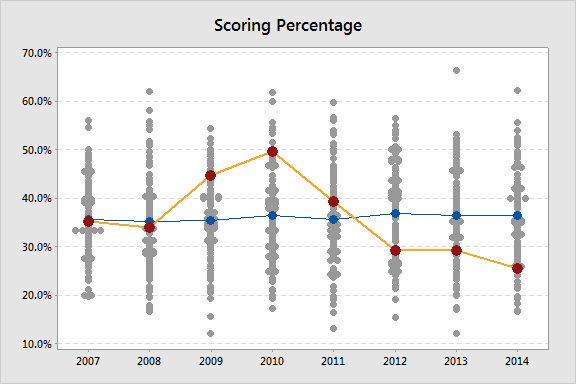
At peak Tyrod, Virginia Tech scored on nearly 50% of offensive drives; fast forward to 2014 and the rate is barely half that. In nearly three out of four drives, the Virginia Tech offense came away with 0 points.
Brian Fremeau, creator of FEI, calculates game splits for the non-garbage time of every college football game. A simple explanation of game split goes like this: Given a certain starting field position, an offense is expected to earn a certain number of points for that drive and they perhaps score actual points or move the ball to field position for another value. From this we can deduce, in points, what each drive was worth (along with special teams, turnovers and extra possessions), sum them for the game (with one team's offensive production being the opposite of the other team's defensive production) and the sum of a team's game splits equals the non-garbage time score difference. To summarize, it's a way to attribute the score difference proportionately to offense, defense, special teams, turnovers and extra possessions.
Here are the offense and defense game splits for all Virginia Tech games, 2007-2014:
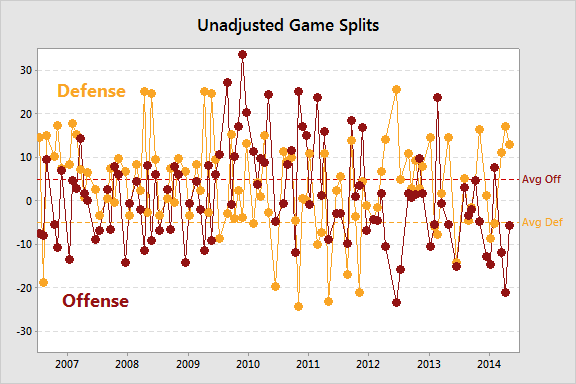
For a period in 2010 and 2011, the offense regularly outperformed the average team; this coincided with a rough patch for Bud Foster's defense in which about a third of games fell significantly below average. Outside of these years there is an interesting pattern: in multiple games, including all but two games this season (ECU and BC) the defense provided more points than the offense. This is in spite of the nearly 10-point advantage the average offense has over the average defense.
The average offensive game split in 2014 was 4.92 points, and conversely the average defensive split was -4.92 points. So a typical offense gains their teams almost 5 points and a typically defense loses that many. The same game splits for Virginia Tech's offense and defense for every game since 2007 were adjusted for these numbers to be relative to average:
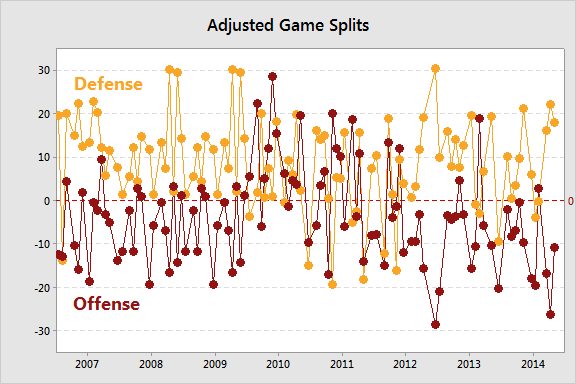
Once you adjust for the baseline, the picture becomes clearer. The Catch was the last offensive play before the Jenga blocks fell. Since that night in New Orleans, the offense's performance has exceeded the defense's performance just twice — the 2013 Miami game and the 2014 Boston College game.
As went Danny Coale's points, so went seemingly all points since.
Move the Ball
Of course an offense isn't good simply because it decides to score points; scoring points is the result of moving the ball and not giving it to the other team. Do both and the team likely scores points. Fail at either and the team likely doesn't score points.
There are two components to moving the ball: the average yards gained per play, and the consistency or variation in yards gained. An offense needs a high enough average, and cannot have too much variation or drives will not be sustained despite a high enough average. Georgia Tech's offense is successful because it simultaneously maintains a high per-play average and high consistency. Virginia Tech's yards per play follows a now familiar trend:
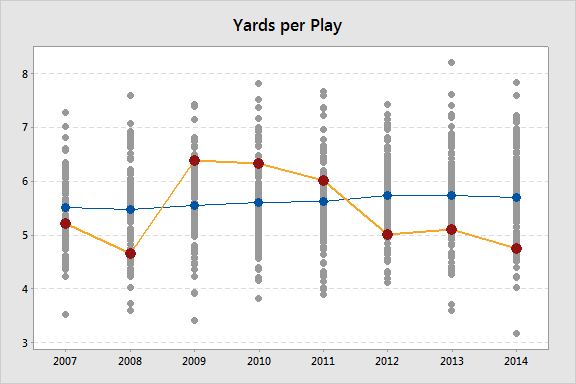
Long-time Hokie faithful most of all miss the ability to successfully run the ball. That leads to the natural question of whether the drop-off in per-play yardage is due to the rushing game, passing game, or both:
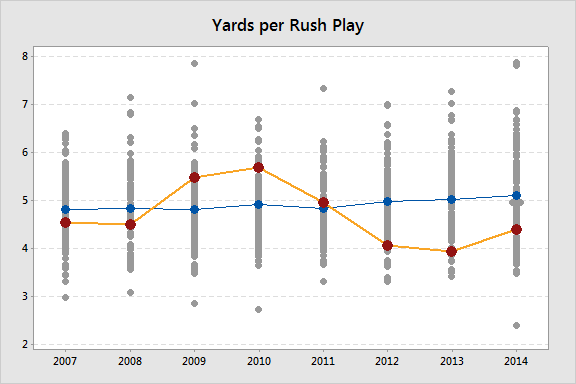
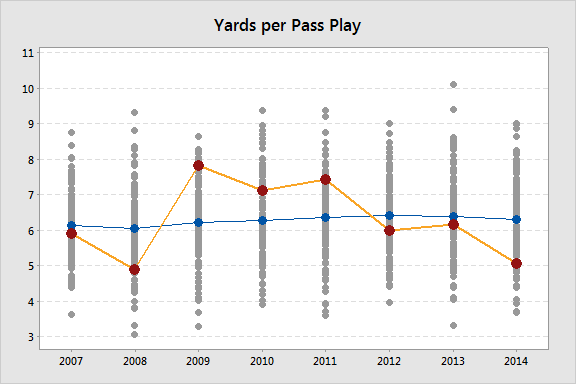
Nationally both statistics have seen a small increase over this time period, while Virginia Tech has seen the same bust-boom-bust pattern for each. The rushing game has, in fact, suffered longer although the passing game in 2014 exhibited one of the worst averages in the nation.
Next is the question of sustaining drives, the other component of successfully moving the ball. For this the basic statistic is yards per drive:

(Note: since teams don't average the same starting field position this statistic can be adjusted to be percentage of available yards; however, in Virginia Tech's case, the graphs are nearly indistinguishable.)
In the year of The Catch, the typical drive saw the Hokies move the ball over 35 yards from the starting point; the past three years have seen this amount decrease by nearly 10 yards.
Don't Give it Away
Even the offenses of 2009-2011 that fans yearn for punted only slightly less than the average team. However, the recent struggles have placed the Virginia Tech offense among the teams that punt most frequently in the entire country. It seems fitting that the 2011 Sugar Bowl featured a 36-yard punt by none other than Danny Coale.
Of course, the advantage of the punt is that it (hopefully) gives the other team the ball much further up the field than the offense stalled. There is a much more devastating way to give the other team the ball, and that is the turnover:
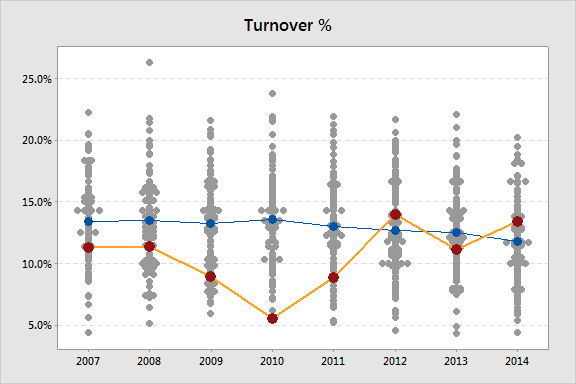
One of the defining characteristics of the Virginia Tech offense for many years was ball protection: in fact, in 2010 the team had a lower percentage of drives end in a turnover than any team in the country at 5.5%. Recent years have seen the team perform around average at best, a rate that is far too high for an offense that doesn't gain enough yardage.
What Is the Identity?
There is little question the identity and personality of the offense has changed in the past few years, but what has changed is not exactly clear. Statistics can validate some of the differences fans have experienced, but as usual in football they are more descriptive than useful in diagnosing specific issues.
When Logan Thomas took the snap that would result in The Catch, he was leading his 10th drive of the game. Just two drives that day had ended in his offense failing to gain a first down: a second half-opening three-and-out, followed by an interception on the first play of the next drive. That 80% rate of gaining a first down was about 10% higher than the 2011 season average, but would be well over 20% above the 2014 season average:
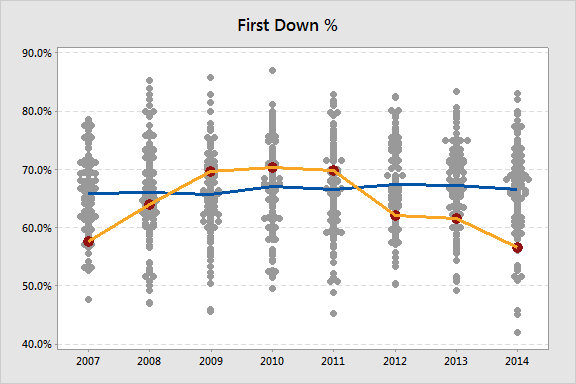
Virginia Tech's offense ranks 117th nationally in first down rate.
Danny Coale isn't just known for The Catch. In fact, if not for the fateful Sugar Bowl play, mentioning the Danny Coale catch would have brought to mind an entirely different game against Nebraska two years earlier. In need of a touchdown with under two minutes to play, Tyrod Taylor connected with Danny on an 80-yard completion that highlighted a 5-play 88-yard drive.
It was the very definition of explosive, and just at the right time. That season the Hokies would have over 17% of drives defined as explosive, averaging more than 10 yards per play:
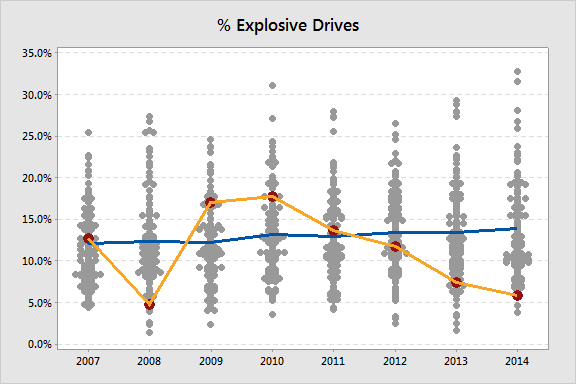
After a slight increase in 2010, the percentage of explosive drives has been on a steady and steep decline ever since, finishing with about 6% in 2014.
Explosiveness is one method of offensive success, but there's another often seen in low-variation teams like Georgia Tech and East Carolina, and that is methodical drives — those of 10 plays or more. Methodical drives is one area where the now-familiar pattern does not hold:
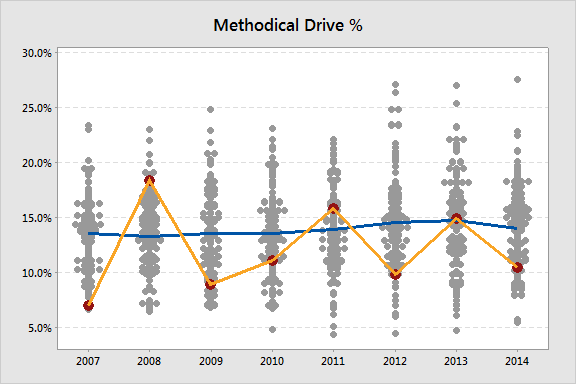
The Hokie offense seems to have settled in a methodical drive percentage a little below the national average of about 14%.
FEI defines one more type of drive: a value drive, one in which a team starts on their own side of the field and moves the ball to at least the opponent's 30-yard line. Unlike methodical drives, this metric returns to the pattern of prior statistics:
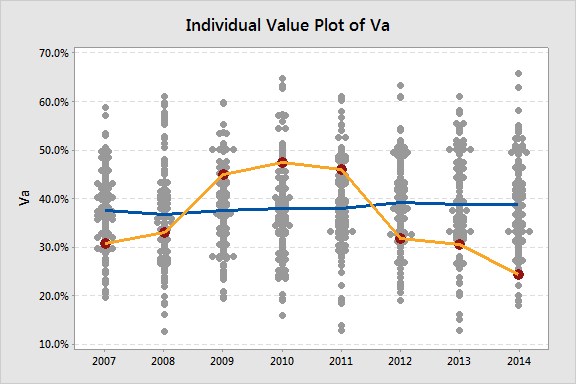
Virginia Tech ranked 122nd in value drives in 2014. There are 128 FBS teams.
Putting It All Together
Everything shown to this point are raw, unadjusted statistics. S&P+ provides some additional context by combining the information to this point with the ability of the opposing defenses to provide an adjusted, best estimate of offensive ability. This is further separated between rushing ability and passing ability:
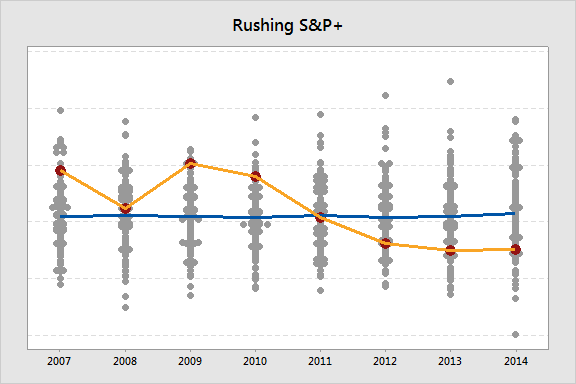

These ratings make clear that offensive woes aren't due solely to the rushing or passing games, and as stated previously those aren't entirely separable anyway. If any glimmer of hope can be taken from these, it's that from 2008 to 2009, under essentially the same quarterback, Virginia Tech went from a below-average passing attack to an elite one. It would be foolish to think that means it will happen again, but worth considering that such a leap in one year is possible.
Finally, a look at the overall S&P+ Offense numbers:
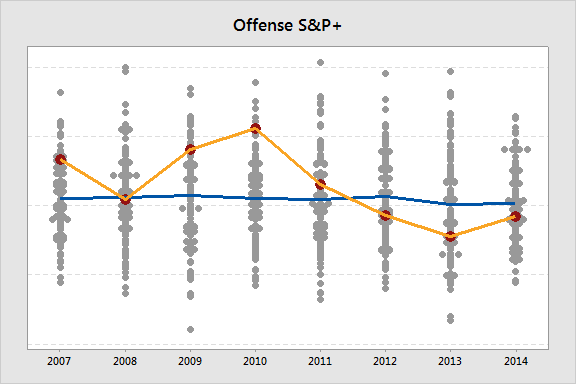
That's the pattern.
The Players
Recruiting rankings are a subjective and inexact science at best, but nevertheless the correlation between a recruit's rankings and his likelihood of performing well and getting drafted to the NFL is strong and indisputable. Danny Coale may have been a two-star recruit before making The Catch, but the quarterback throwing to him was a coveted 4-star recruit (albeit projected to be a college tight end).
As excellent of a job as Virginia Tech as done developing players that were not rated exceptionally high, most of the truly elite players to come out of Virginia Tech were 4- or 5-star recruits. It has been a very long time since Virginia Tech has attracted a 5-star recruit on offense, and none appear to be coming in the near future.
However, it is worth looking at the average rating of offensive recruits (for this analysis the offense was credited for those recruited as athletes even though some ended up on defense) starting in 2006 to examine any patterns that may appear:
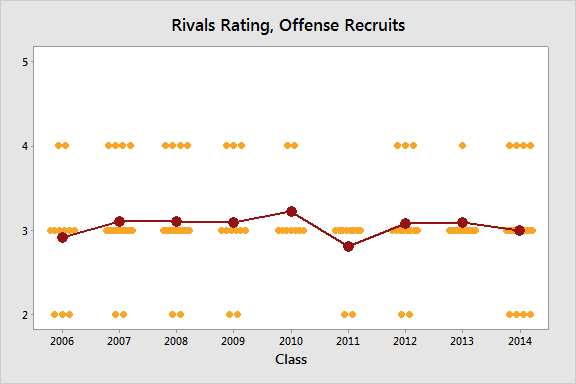
Outside of brief swings in 2010, when no 2-star recruits signed, and 2011, when no 4-star recruits signed, Tech consistently signed just slightly higher than 3-star offensive talent. When one considers the development of players at Virginia Tech, it is often on the defensive side of the ball; Tyrod Taylor, Ryan Williams, David Wilson, both Vicks, Kevin Jones, etc... were all highly-rated entering Virginia Tech.
Putting It All Together
If the play called doesn't put Danny Coale in a position to make The Catch, the ball never gets thrown his way. If the offensive line doesn't provide pass protection, Logan Thomas gets sacked, throws it away or tries a desperate scramble for first down. If Coale doesn't run his route well, he never gets that step on the defender. If Logan Thomas doesn't put the throw in just the right place, it falls incomplete. If the review official doesn't erroneously reverse the call on the field, Virginia Tech wins the Sugar Bowl. The Catch happened because each piece was successful, and it didn't happen because of events outside of its control.
There is no question that the Hokie offense suffered a decline after 2010 or 2011, and currently sits well below average. Nothing in statistics can clearly point to just one aspect of the offense that is to blame. Just as each piece had to be successful to make The Catch happen, each piece must be successful to make the offense click. It's possible that the pieces are there and events outside of the team's control — especially injuries — have sabotaged progress. Or it could be that at least one of those pieces is failing and holding back the others. It is easy to find fault in all aspects of the offense this year, but also easy to find reason for hope.
The offensive line often looked like a wet paper sack, but in the middle of the onslaught was Wyatt Teller pancaking some helpless defender.
Tech's running game often failed to make it back to the line of scrimmage, but we saw real talent from two true freshman tailbacks early in the season, and J.C. Coleman has recently lived up to his 4-star hype.
Michael Brewer threw some really brutal interceptions, but he was absolutely abused by defenders all season and kept getting up.
Scot Loeffler's game plans often seemed too complicated and play calling wrong for the situation, but then he called a great game against Virginia to make it 1.1 x 10^1 in a row.
Wake Forest happened. But so did Ohio State.

Comments
I always love me a barrage of statistics to try to quantify my experience as a fan. Thanks for the write up Joel!
"I told you the offense was a steaming turd of a dumster fire! Just look at these graphs!"
"Honey, it's 3 in the morning. Go back to sleep."
How can you hear what happens in my house?
To comment on my own article...
One of the things that struck me while compiling this wasn't just that our offense has become fairly terrible, especially for a team with high aspirations. It was just how close we came to putting together a true national title contender in 2010. It is incredibly unfortunate that that year coincided with a temporary but very real downturn in defensive performance - with a typical Bud Foster defense, you are looking at top 10 defense and offense, which is what you see from national champions.
Winning a championship is obviously very difficult, especially without the recruits an Alabama gets. But if you ever lose hope that VT is capable of competing for a title, just remember that we've been there once and were bad timing away from it happening again just a few years ago. Most teams win championships because everything comes together just at the same time (and perhaps luck too), and Virginia Tech is a team very capable of doing it if the offense can put itself together.
Hope everyone has enjoyed reading and hopefully even learned something...
Also, if Tyrod redshirts freshman year, good chance he would have been starting as a 5th year senior in the 2011 team....national title run would have been expected
So...you're saying all of this is Glennon's fault?
/s
no not Glennon, it's on Marcus Vick.
Don't forget in 2007 we finished #3 in the BCS...with a loss to LSU. Weve been close at least 3 times since 2000
We got whipped 48-7 by LSU. While we were highly ranked in the BCS, we were not that close to reaching the championship game.
I would still call that close. Our team against LSU looked like a team with helmets up asses. Towards the end of that game, helmets started to emerge, and the team started to look like something. The whole rest of the season we looked like something. A lot of us wished that we had managed to get ourselves together for our opener and not just all the games after the opener.
We weren't ready for that game. We REALLY weren't ready for the ECU game before that. Don't get me wrong, we NEEDED that game to help heal, and we won it, but weren't ready for it. With all of the emotion and tributes going on that day, the football game itself took a backseat. Then only a week after that emotional rollercoaster, the team has to go into one of the most difficult places to play to face a highly ranked opponent. That's a lot to ask of a group of 18-21 year old kids in a short amount of time, and they were understandably flat and emotionally drained. By the end of that year I think we could have gone toe to toe with them.
Actually, if (yep let's play the "if" game for a second) we hadn't lost to BC, then we would have had only one loss and likely would have faced anOSU for the title. LSU would have been left out as they had 2 losses while OSU was undefeated and we would have only had one loss. Damn you Matt Ryan!
There was absolutely no way that we would have gotten into the championship game. The pollsters would have jumped someone over us, like Ohio State over TCU this week, because it was said often and loudly that we were stomped by LSU. We weren't getting in, period.
There was an agenda that year, a bigtime agenda.
We were #1 in the computers. The human polls realized this and hammered us so hard that we dropped to a distant 3rd in the final rankings.
The old saw about football being a game of inches where a few plays and turns of chance have disproportionate effects is very true.
I assess margins for a living as a Engineering R&D manager. So I absolutely love the stats breakdown. A lot of it is using your capabilities (Offense, Defense, Special Teams) to alter the opponents probabilities for being able to influence the same.
In the case of 2010 for instance, just to show how razor thin the margins are, if we run the ball on all three plays in our last series against Boise, we burn the clock and leave Boise with much less time to run down the field and score the go ahead TD.
We win that one going away and perhaps we don't flub the JMU game away on a short week.
This lack of what I call "small football" had driven me crazy for years. In a razor thin margin game the details matter, and being clock smart (instead of clock oblivious or down right stupid) could have won us a few games all by itself. When you're skating on thin margins every advantage helps.
Stellar work!
Man... Good writeup...
I think this also kind of shows what a few have been saying all along. The issues we have on offense aren't exactly new to Virginia Tech, they were just covered up for a couple years by the fortunate QB play of Tyrod and Logan.
I also find it interesting that, outside of Tyrod's senior year in 2010, we've never had a team that consistently put together good offensive and defensive performances. I found this chart to be the most telling:
That right there shows a team that is as disjointed as it can get. When the offense is clicking, the defense almost always puts up a stinker. When the defense is playing lights out, the offense can't do a thing. And this is a trend that extends back to Tyrod's early years (and I suspect if we take that back to 2000, we'll see it be the case for the vast majority of the games there as well).
And this right here is probably the dagger:
At most, this year we were playing with 3 non-redshirt upperclassmen who came in as anything more than a 3*. That year in 2010 when we peaked? That number was 8. For those who say that recruiting rankings don't matter, its hard to argue with this chart right here. We peaked when our upperclassmen 4* numbers were at their highest. We're at our 22 year worst when those upperclassmen 4* numbers are at their lowest.
I was going to say this also might be a situation where the numbers are misleading since the offensive recruiting numbers stay around average but it doesn't say who was recruited for what. I think a deeper dive as other threads have done/are doing reveals more interesting information then the stats. For instance how many players panned out at the position they were recruited for, how many players made it on the field for Va Tech, what the effect of recruiting athletes over people who play a certain position...etc.
Maybe an offseason project! Another factor I'm interested in examining is how players from powerhouse high schools pan out compared to smaller schools. It seems to me like those for powerhouses get too much credit, much like college players from really good teams seem to get overvalued in the NFL draft because it's hard to separate the contribution from that individual player from the contributions being made around them.
I'm a step ahead of you there, I took a step towards doing this over the summer but alas I ran out of time and didn't have a powerful enough computer. With a desktop ready to be assembled at my permanent address expect statistics and GIS data to be punched in here soon to create some beautiful and colorful maps labeling recruiting hotbeds and some percentages and exact numbers of how recruits panned out
GIS analysis of college football recruiting?
You have me drooling.
Yeah I'm gonna crunch some numbers over winter break, and hopefully have the maps out at the beginning of the spring semester (I won't have the gis software until then) and plus I'll be able to ask Dr. Shao questions if I get stuck. I'll have to brush off some rust as I haven't worked this software much over the past year
I like Carlton and all, but every time I look at this Gif I think that Sadie should have won.
I will preface this by saying I am a stalwart of defending recruiting rankings. They matter. Except here.
There is such a SSS issue with the recruiting numbers that it doesn't tell us anything. This is a situation where one good player could have swayed a lot of the stats, and he doesn't need to be 5* to do it. Jim Druckenmiller made our offense good. Michael Vick was a 3*. Jake Grove. Ernest Wilford. Coale, Boykin, Montgomery, etc. Maybe a 4* RB like Ryan Williams or David Wilson would have made a huge difference. Or a 2* Brandon Ore. Logan Thomas made a difference, but he wasn't really a 4*. As a QB, he was probably a low 3* type of recruit, or worse. LT was a 4* athlete, not a 4* QB.
Recruiting rankings work at a macro sense. This is a time period of a unit of a small group of players. Literally, the last three years, we have had like 40 or 45 players play offense. One or two better players may have made a significant difference, but their star ranking isn't that important.
There are always exceptions, and there are NFL studs who had to walk on to even play in college. But reverse things for a minute:
- What percentage of our 5 star recruits have panned out as great college players? 100% if Marcus Vick isn't an idiot off the field.
- What percentage of our 4 star recruits have panned out as great college players?
- What percentage of our 3 star recruits have panned out as great college players?
- What percentage of our 2 star recruits have panned out as great college players?
Exceptions don't negate the relationship. It's great that we've had unheralded recruits turn into studs whether through poor scouting by services or coaching once they arrive, but the fact remains that the more stars a recruit has, the more likely he is to be a great college player and it's not even close. There are way, way more 3 star recruits out there than 5 stars so naturally there will be some that were grossly under-rated or over-rated.
To say star ranking isn't that important is to say that you don't really care where Sweat commits this week since we already have some 3-star guys. Of course a couple of the 3 stars will turn out great and a couple will never see the field or even the two-deep. But a 5-star is almost certain to be great.
You only need one 5-star to have one great player. You need a few 3-stars to have one great player.
Again, I'm not arguing that recruiting rankings aren't important. I will argue they are important, forever. I understand the probability principle at play here. 5*, very likely to be an impact player. 2*, not very likely.
What I'm saying here is that in 45 players, one or two impact players could have made a huge difference. And those impact players could have come from a 2* or a 5*. There is a higher probability that if we had signed a 4* QB we recruited like Marquise Williams (or his Rivals comps: Braxton Miller, Teddy Bridgewater, Brett Hundley) it would have been a slightly higher chance of success than if we had signed the 3* QB recruit we went after that year, Everett Golson (and his Rivals comps: Johnny Manziel, Dak Prescott and Rakeem Cato)
So the difference between a 3 and 4 star in that small of sample isn't that important. (Frankly, VT needs to discount 5*'s altogether since we have ....what....four...ever?)
There is a GIANT difference between pulling in 8 4* players over 2 recruiting classes and pulling in 1 4* player over 2 recruiting classes. That talented senior leadership on offense is the difference between 2010 and 2014. Thankfully, its starting to look like 2016 might be the start of something nice, based on this trend. (that being said, we have to keep bringing these highly regarded players in).
Sure, any impact player CAN come from a walkon, 2*, or 3* player, and most of the time you're going to find at least one or two in a recruiting class that do pan out into those players. However, the chances that a 4* or 5* player becomes an impact guy is significantly higher than any other. If you load up on 4* players to the tune of bringing in 4 or 5 of them a year, the odds that you're going to have a team chock full of super talented impact players is extremely high. When you don't bring any of them in, and struggle to sign even one player a year, you're going to see teams like the 2014 Virginia Tech offense. And even more telling, the impact players we had this year on offense? Basically every single one of them came in as a 4* player.
I'm clearly not communicating what I'm trying to say since I don't disagree with you. So I'll let it go.
I run into the same thing.
Also, without facial expressions and gestures, it can be difficult to recognize where the emphasis and tone lie.
The difference between a fun rejoinder and a jab in the ribs is the grin we cannot see.
I think I know what you're trying to say:
2010 is not that shocking. Tyrod, RW, DW, Boykin, Coale, Davis - a stud mobile QB, two stud RBs, three field stretching (for college FB) WRs
2011 is shocking to me. LT, DW, Boykin, Coale, Davis - stud QB (great year for LT), stud RB, same older wiser WRs
what happened between 2010 and 2011?
explaining these things is way more than saying we had 4 or 5 stars at x positions. great data dive and analysis but it needs the so what applied to it and it can't be a numerical so what.... causative analysis with hypothesis talking to the football gurus, consulting the data to rule out the hypotheses
awesome analysis... very good read
The way I see it:
5* recruits have an ~80% chance of panning out
4* recruits have a ~60% chance of panning out
3* recruits have a ~40% chance of panning out
2* recruits have a ~20% chance of panning out
Panning out = making a noticeable, positive effect on the field.
Doesn't someone keep actual statistics on this kind of thing? You'd think with all the effort that goes into recruiting these days someone like Nate Silver would be checking behind the star ratings to see if they mean anything.
Try this:
http://www.footballstudyhall.com/2014/2/5/5382140/recruiting-matters-why...
Or this:
http://www.sbnation.com/college-football-recruiting/2014/5/12/5696710/nf...
Both excellent articles. Thanks for bringing them to my attention. The logical fallacy discussed at the beginning of the sbnation article was particularly interesting: it may account for several of the misunderstandings I've read. The conclusion that ratings don't matter seems to be based on anecdotes and muddy thinking.
If possible split out players who were recruited for a position that they didn't play in HS. In particular, I'm thinking about all of the RB's who are recruited to play WR. The kids that are coming in are fantastic athletes, but it's clear that I Ford and Phillips were more prepared to play WR than any VT WR since the Royal/Hyman/Clowney/Morgan group.
I'd be curious to know if this is typical for most teams. My guess is that while VT may take it to an extreme, most teams would have this type of look to their graph when looking at offense and defense.
I absolutely love these joel thanks a lot. But this entire article gave me serious sadz...
Put that Nebraska video on loop. You'll feel better.
Joel, as sad as it was to see the actual numbers, I have to thank you for the fantastic analysis. Not just this one, but all through the season. I usually don't comment a whole lot on these threads, because I just sort of like to digest the information, but your stats breakdowns are among my favorite things to read on this site.
Not only is this an excellent quantitative analysis, but it's framed incredibly well using exciting and heartbreaking moments. I guess that pretty much sums up VT football in the last decade or so - elation and devastation. Now we have some numbers to tell us why we feel the way we do.
Thanks VTGuitarMan! Feedback is always welcome...I have a few months to update the script that generates the graphs each week and am mostly limited by what data is readily available.
Hot damn do I miss Tyrod though..
cc: HokieAD@vt.edu or nah?
Why? What would that accomplish? You think it hasn't occurred to him that the offense isn't very good?
i wasn't really being serious. i'm sure whit wouldn't click the link, even if it made its way through his email filter (thanks swvadon).
but when evaluating someone's job status, going to a higher level than 'the offense isn't very good' (with some great statistical analysis?) might be a good idea.
Good point made on the 'hard evidence' vs. just ranting.
I mean, it's not like we were a powerhouse the year before Lefty got here. It's a lot easier to fall from the top than to climb back up there.
'climb' implies upward movement.
If you look at the S&P+ numbers there was upward movement. When you adjust for the defenses we're playing, the offense actually was better than last year. Unless I misunderstood what I was reading just now.
The trouble is that God Awful being slightly better than Hellaciously Awful is a hard pill to swallow.
There's a reason Whit has his email on auto-response these days. It's because people have not been responsible when sending him an email this fall. Instead they blast off stuff emotionally and immaturely. As such, they've ruined what began as a nice line of communication between the fan base & the AD. Now he's had to install a filter to cut out the massive amount of garbage he receives fitting the above description - emotional & immature. It's really unfortunate.
Watching that NEB game from the NEZ tho...
As soon as I graduate, everything goes off the rails. I'm sorry guys, it's all my fault.
Great write up..nice to see the numbers to back up how we all feel. Very interesting. Thanks for doing the leg work on these stats. Not something most of us would have the patience to accomplish.
Tyrod, you beautiful champion king, we miss you so.
Pouring out half for Tyrod. We miss you so much homie.
Is that 40 half full or half empty?
I meaaaaannnn...Tyrod's still alive.
Thanks, Joel, for this fantastic analysis!
I find it hard to believe that we had a game with a worse offensive performance and better defensive performance than the recent Wake Forest debacle. But there it is in 2012. I'm assuming that's the Rutgers bowl game. We gained a total of 196 yards, but the defense held them to 3 points (their defense scored 7 on the first play of the game). I had to go back and look up those stats as I apparently had blocked out all memory of that game other than getting the W to finish 7-6.
I know statistically you make a good point that the Danny Coale catch was the beggining of the end but I believe it was a David Wilson fumble against Clemson! We were running them like drano up to that point then our whole football universe got turned upside down... Butterfly effect!
The Coale catch was symbolic in so many ways. We had just been invited as an At-Large team to a BCS game! Virginia Tech! BCS Bowl when we didn't have to be there! That was the top of the world, in a lot of ways, that symbolized us making it more than the BCS Title Game. We were in the club! Playing a Blue Blood!
And we had them beat. The total yards and FD advantage in that game is sickening. We should have won 27-10. And if we had won that game, maybe it makes a difference in how the next two years goes.
^^^^THIS!!
When I think of the low points of that game, I think of the "Catch" and I think about Eddie Whitley, as free safety, jumping a route for a pick he did not get and allowing the receiver 20+ yards after catch for a touchdown because our last defense missed the pick. Plus that feeling of all the turnovers and penalities around the half, and thinking how long can this chaos really go on? We were the better team that day, but we didn't bring home the W.
Also, both of Hosley's picks that were taken away due to phantom PI calls. Those were horrendous.
Nothing foreshadowed our pending offensive awfulness quite like David Wilson running 20 yards backwards on first and goal from the 7.
And Michigan's offense being basically prayers thrown up by their super mobile qb (who we held to basically 0 yards). Won everything but the game. That bowl, and the bowls against Georgia and Kansas where 3 high profile games we SHOULD have one. Things might be different now if we held onto them.
I think of the luckiest Effin field goal fourth down conversion of all time. Bad snap, the holder rolls out and just throws it up, a Michigan player magically comes down with it, and the refs fail to spot the 30 ineligible receivers down field.
Inconceivable.
Whitley was never that great of a player anyways. Just watch his "performance" in the Orange Bowl vs Stanford.
That, I think, is a bit of a stretch. Our struggles subsequent to that game are a result of failures in recruiting, IMO. I think of that game akin to Texas' BCS championship with Vince Young over USC: one last hurrah with all out senior talent before reality caught up with us. This dip was inevitable due to the horrific state of the OL, inability to recruit a true successor to Tyrod, etc. Winning that came would not have miraculously put ten 4 star recruits on our roster.
Personally, I see enough nuggets of hope in these stats with recruiting, rushing actually up-ticked this year, and all the injuries. I have a lot of hope for next year, regardless of the QB. I have more confidence that we will trend up on O, than to blow the whole thing up again on the coaching front. But if we do have ANOTHER down year, big changes are needed to keep the program moving forward.
Also watching that catch by DMFC still makes my blood boil that it was overturned!
What the article does NOT address is that we switched offensive systems during that time to address the downward trend. Some would say the current system is more offensive, others not offensive enough...
Either way, we've had a real shift away from a running QB threat to pro-style first offense. The reason I mention this under a "recruiting" comment is that running a pro-style offense is intended to help our recruiting. It is no secret VT has had issues recruiting QBs in the past. (They've had issues recruiting WRs too, but player development has turned the WR squad into gems.) While half of the ACC was led by a high-rated Virginia HS QB (as well as several other teams) we were switching our coveted TE recruit to QB because we didn't have anyone in the pipeline behind Tyrod. The cupboard is now getting stocked with better recruits that are interested in playing in a next-level system, but the pro-style system relies on your guys being better athletes than the other squad. You hear all the time about creating mis-matches; we'll if you don't have the athletes the mis-matches go against you.
I was worried Loeffler would be fired after I watched the WF debacle, because that was about as bad as an offense can sink. This offense may need a FEW MORE YEARS to get back above the national average. But players like Ford, Bucky, Teller, Shai, Edmonds, and Williams have me convinced that VT is getting the athletes to bully the competition on offense. I remain hopeful that a combo of Brewer and Motley can get the job done until Loeffler at least gets "his own" QB in place.
A good hypothetical question: Would we have beat OSU with the former offensive coaches in place (and that including their recruits?)
NO
Its curious that the VT offensive trends seems fully dependent on the players themselves and not on the staff running the team. I would have hoped to see even marginal improvement from Loeffler's first year to now but there appears to be a negative trend. I guess what I am saying is that would any of this have changed with any other offensive coordinator or even with three different ones? Perhaps as people claim "he needs a few years to get his guys in the system" we should expect vastly improved offensive numbers in 2015 if the coordinator makes a real impact. I look forward to seeing how it plays out and remaining hopeful that offensive performance can be affected positively by the right coaching/playcalling. I would have preferred to see improvement from better coaching regardless of the players on the field but that is not apparent in this data.
The general rule is that any problems now can be traced to recruiting from 3-4 years ago (juniors and seniors). I'd say that's partly the case here, indicated by the large proportion of freshman impact players: the upperclassmen that would traditionally hold those spots were beat out. Loeffler is still reaping what was sown under the old regime. If we change coordinators, hopefully they continue the improved recruiting, but they will also benefit from Loeffler & Co's work chopping wood.
I'd guess we see an improved offense in the near future, partly because we can't get much worse and partly because offensive recruiting had ticked up in the last couple years
Effectively this is Scot Loeffler's first year in trying to run the offense that he wants to install. Last year was the LT year. That said there needs to be remarkable improvement in year "two" of the Scot Loeffler offense in 2015 for him to stay beyond next year.
I look at it as Year 4 of Scot Loeffler as OC. And he's now 1 for 4 with 3K's in a row.
Did any of the players that played all year get any better than they were week one? for me, there is no credible evidence of progress. I see defensive players get coached up every year, doesn't happen on offense.
All that said, biggest issue for the offense has been the sharp drop of the quality of the oline play.
Who got better?
Let's start with -McKenzie was improved until he ACLed.
Hodges was much batter all the way around, especially route running and his accelerating numbers show this.
Rogers improved significantly and quickly in the beginning of the season.
Coleman, like a monster.
Teller.
Both Ford and Phillips got better at route running. And some in decision making and made differences with the improvements.
There were many guys improved in the course of the season on offense.
Marshawn was improving too. The last few games he played he was finding more holes and showing patience that he hadn't earlier in the season.
Yup.
On the whole a large number of players were improving as the season rolled on.
But other guys had to replace them that were not up to the level of play of the ones we lost.
Does anybody know where to get a final breakdown of who was hurt, when they were hurt and what games they missed?
Does the ACC keep records of injury reports? Or surely we could just search TKP for the old injury report threads couldn't we? Doesn't Joe always post the report before each game? Those threads should still be here.
I'd argue Bucky, I. Ford, Cam Phillips, Wyatt Teller, Marshawn Williams, and most of all JCC showed significant improvement over the course of the season. Marshawn, of course, got cut short.
Interestingly, there seems to be an almost direct correlation between these charts and the amount of new white hairs my scalp produces.
2010 season was definitely the year to make a run. 99/100 VT beats JMU, that one just happened and Boise St should have been a win, don't get me started on that game again though, I still get pissed about how we lost that game to date.
To this day I am still adamant that we didnt lose to JMU but we let Boise St beat us twice.
We were far too busy looking backwards & not looking forwards.
Joel -- Thanks for the awesome statistical analysis and write-up! what software do you use--and do you work with math/stats/data or just do this kind of stuff as a hobby?
again, great work...the data tells an undeniable story. as you stated...they are mostly descriptive stats and unfortunatey don't prescribe fixes (other than ... "we need better offense"). Here's to hoping we are turning a corner. Go Hokies!
Yes! A nerdy question!
Generally speaking the data is compiled in Excel and then any analysis and graphs are done using Minitab 17. I am a statistician by profession and do everything I can to keep articles simple while using statistics that are most telling...sometimes something more advanced could be done but in my mind if you can't explain it in one sentence people won't care that it's a little bit better.
Is there any way you could write your insanely devised overly complicated number crunching methods into footnotes that we don't have to read, but if we're already hooked on the one sentence explanation stats, we can dive even deeper into the mind of Joel Smith - Numbers Wiz? I know that I for one can never get enough of these articles, and would really like to know what other advanced techniques Joel Smith - Numbers Wiz has available to him.
Pointing to some other resources would be good help:
1. Both S&P and FEI get posted to footballoutsiders.com. They have a ton of good stuff and explanations, although much of their stuff is on the NFL because they have better data available to them.
2. The book Study Hall by Bill Conneley gives a good overview of his thinking towards "advanced" stats. Of course there's no one "right" way, but his is fairly simple and well thought out.
3. Many ranking systems do not share the details of their methods but some do. Google "Massey consensus" (bonus: Massey is a Hokie) and you'll find links to tons of computer rating systems as well as a composite rating.
Awesome! I'm an ops research guy and I've enjoyed seeing the simple yet elegant & informative charts from week to week. Kudos!
I think the current staff should get another try. But if it looks bad next year, something's gotta be done, quickly. The longer we stay down the longer it will take to us build back up.
As the numbers suggest, we don't need a great offense. We're not asking our offense to go out there and be Baylor or Oregon, we just want an average offense. Our defense can pull an average offense up, they can win championships with an average offense, but they can't win with a bad one.
The focus on offense should be contributing what is needed to complement the defense, and standard stats like total and scoring offense don't need to be dominated. A long time ago I said I call it offensive success when we have more field goals than punts, more touchdowns than turnovers. Manage that and I think we give the defense what it needs to be successful.