
Beginning with the inaugural ACC Championship Game in 2005, the Coastal Division has been represented by either Georgia Tech or Virginia Tech every year except for 2013 (Duke). In most of those years, it seemed obvious said trend would continue even before the season got started. 2015 was no different. Georgia Tech was a preseason dark horse playoff candidate, and several national sportswriters pegged the Hokies to take a huge leap forward.
Obviously something went wrong. Virginia Tech fans know all too well why their team has struggled, but what bumps did the Ramblin' Wreck hit and can the Hokies take advantage?
Where the Season Stands
Virginia Tech is currently 4-5. The actual and predicted score difference and odds of winning each game are:

Georgia Tech remains a slight favorite, mostly due to the game being played in Atlanta. North Carolina has gained an even bigger advantage after its dismantling of Duke last weekend. Any discussion of how emotion may play into that game will have to wait until next week. Otherwise, Virginia remains the lone remaining game in which the Hokies are favored, albeit at this point by a narrow margin.
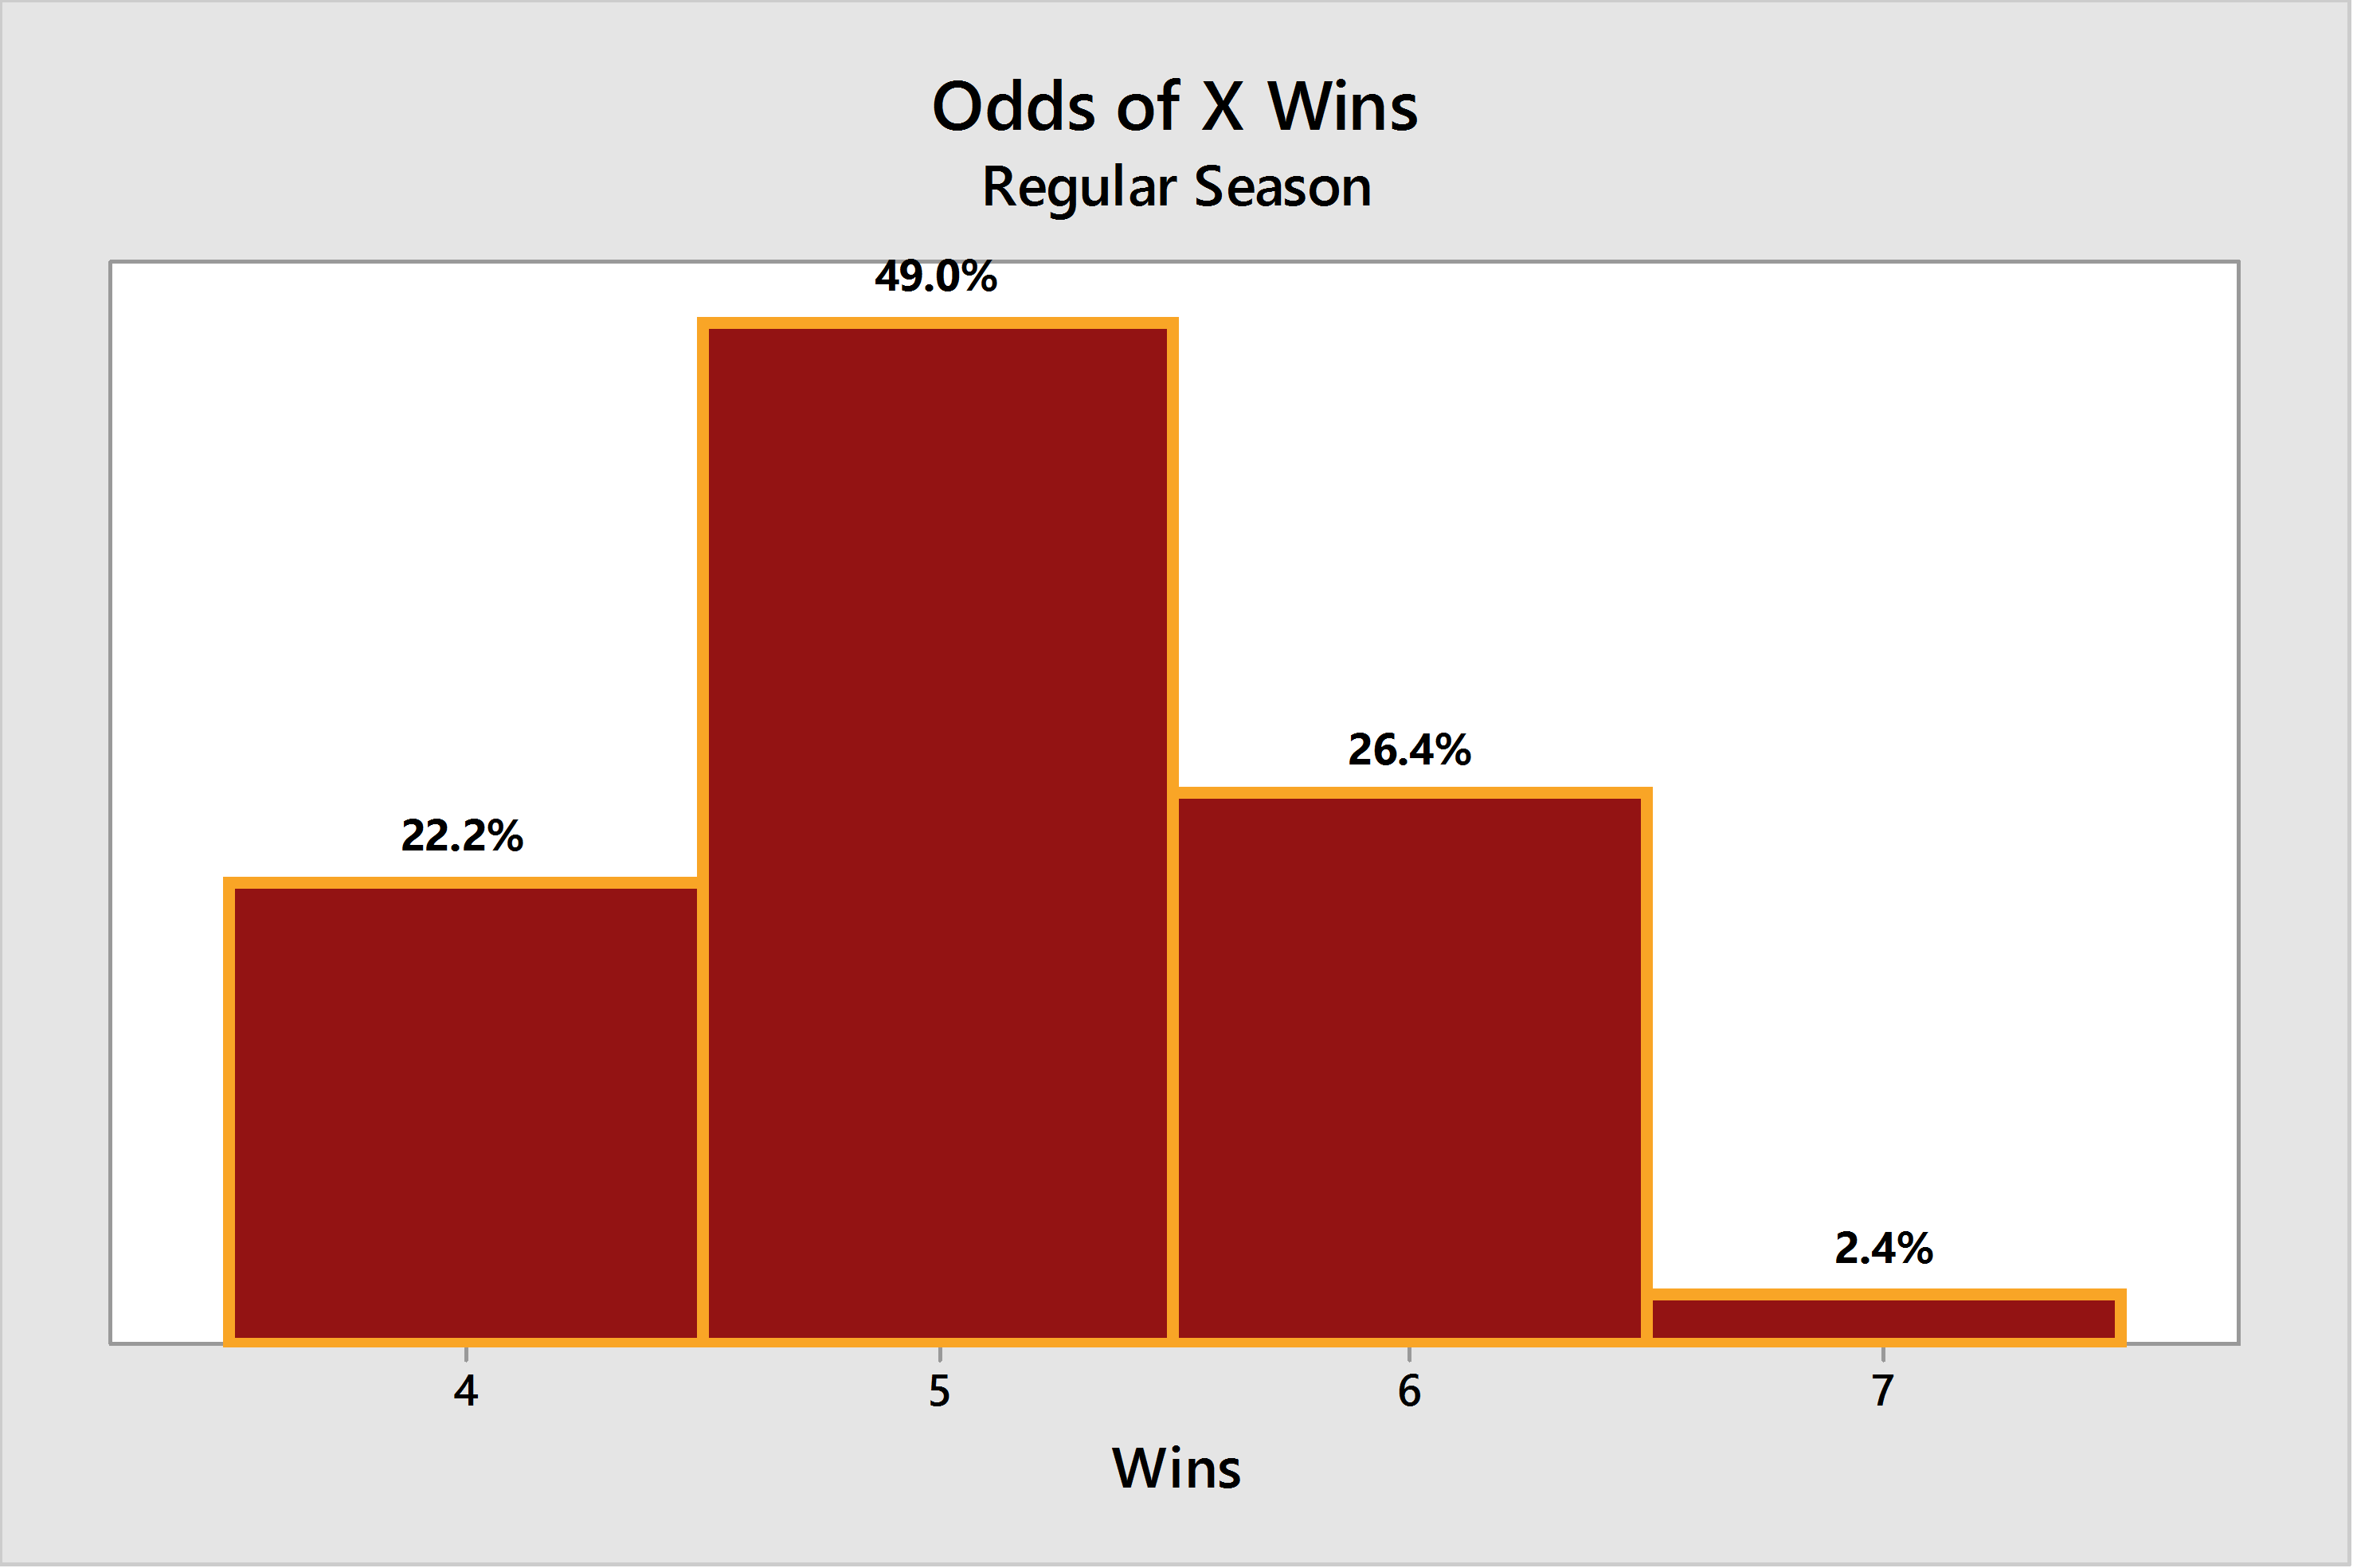
The odds of each possible regular season win total are now:
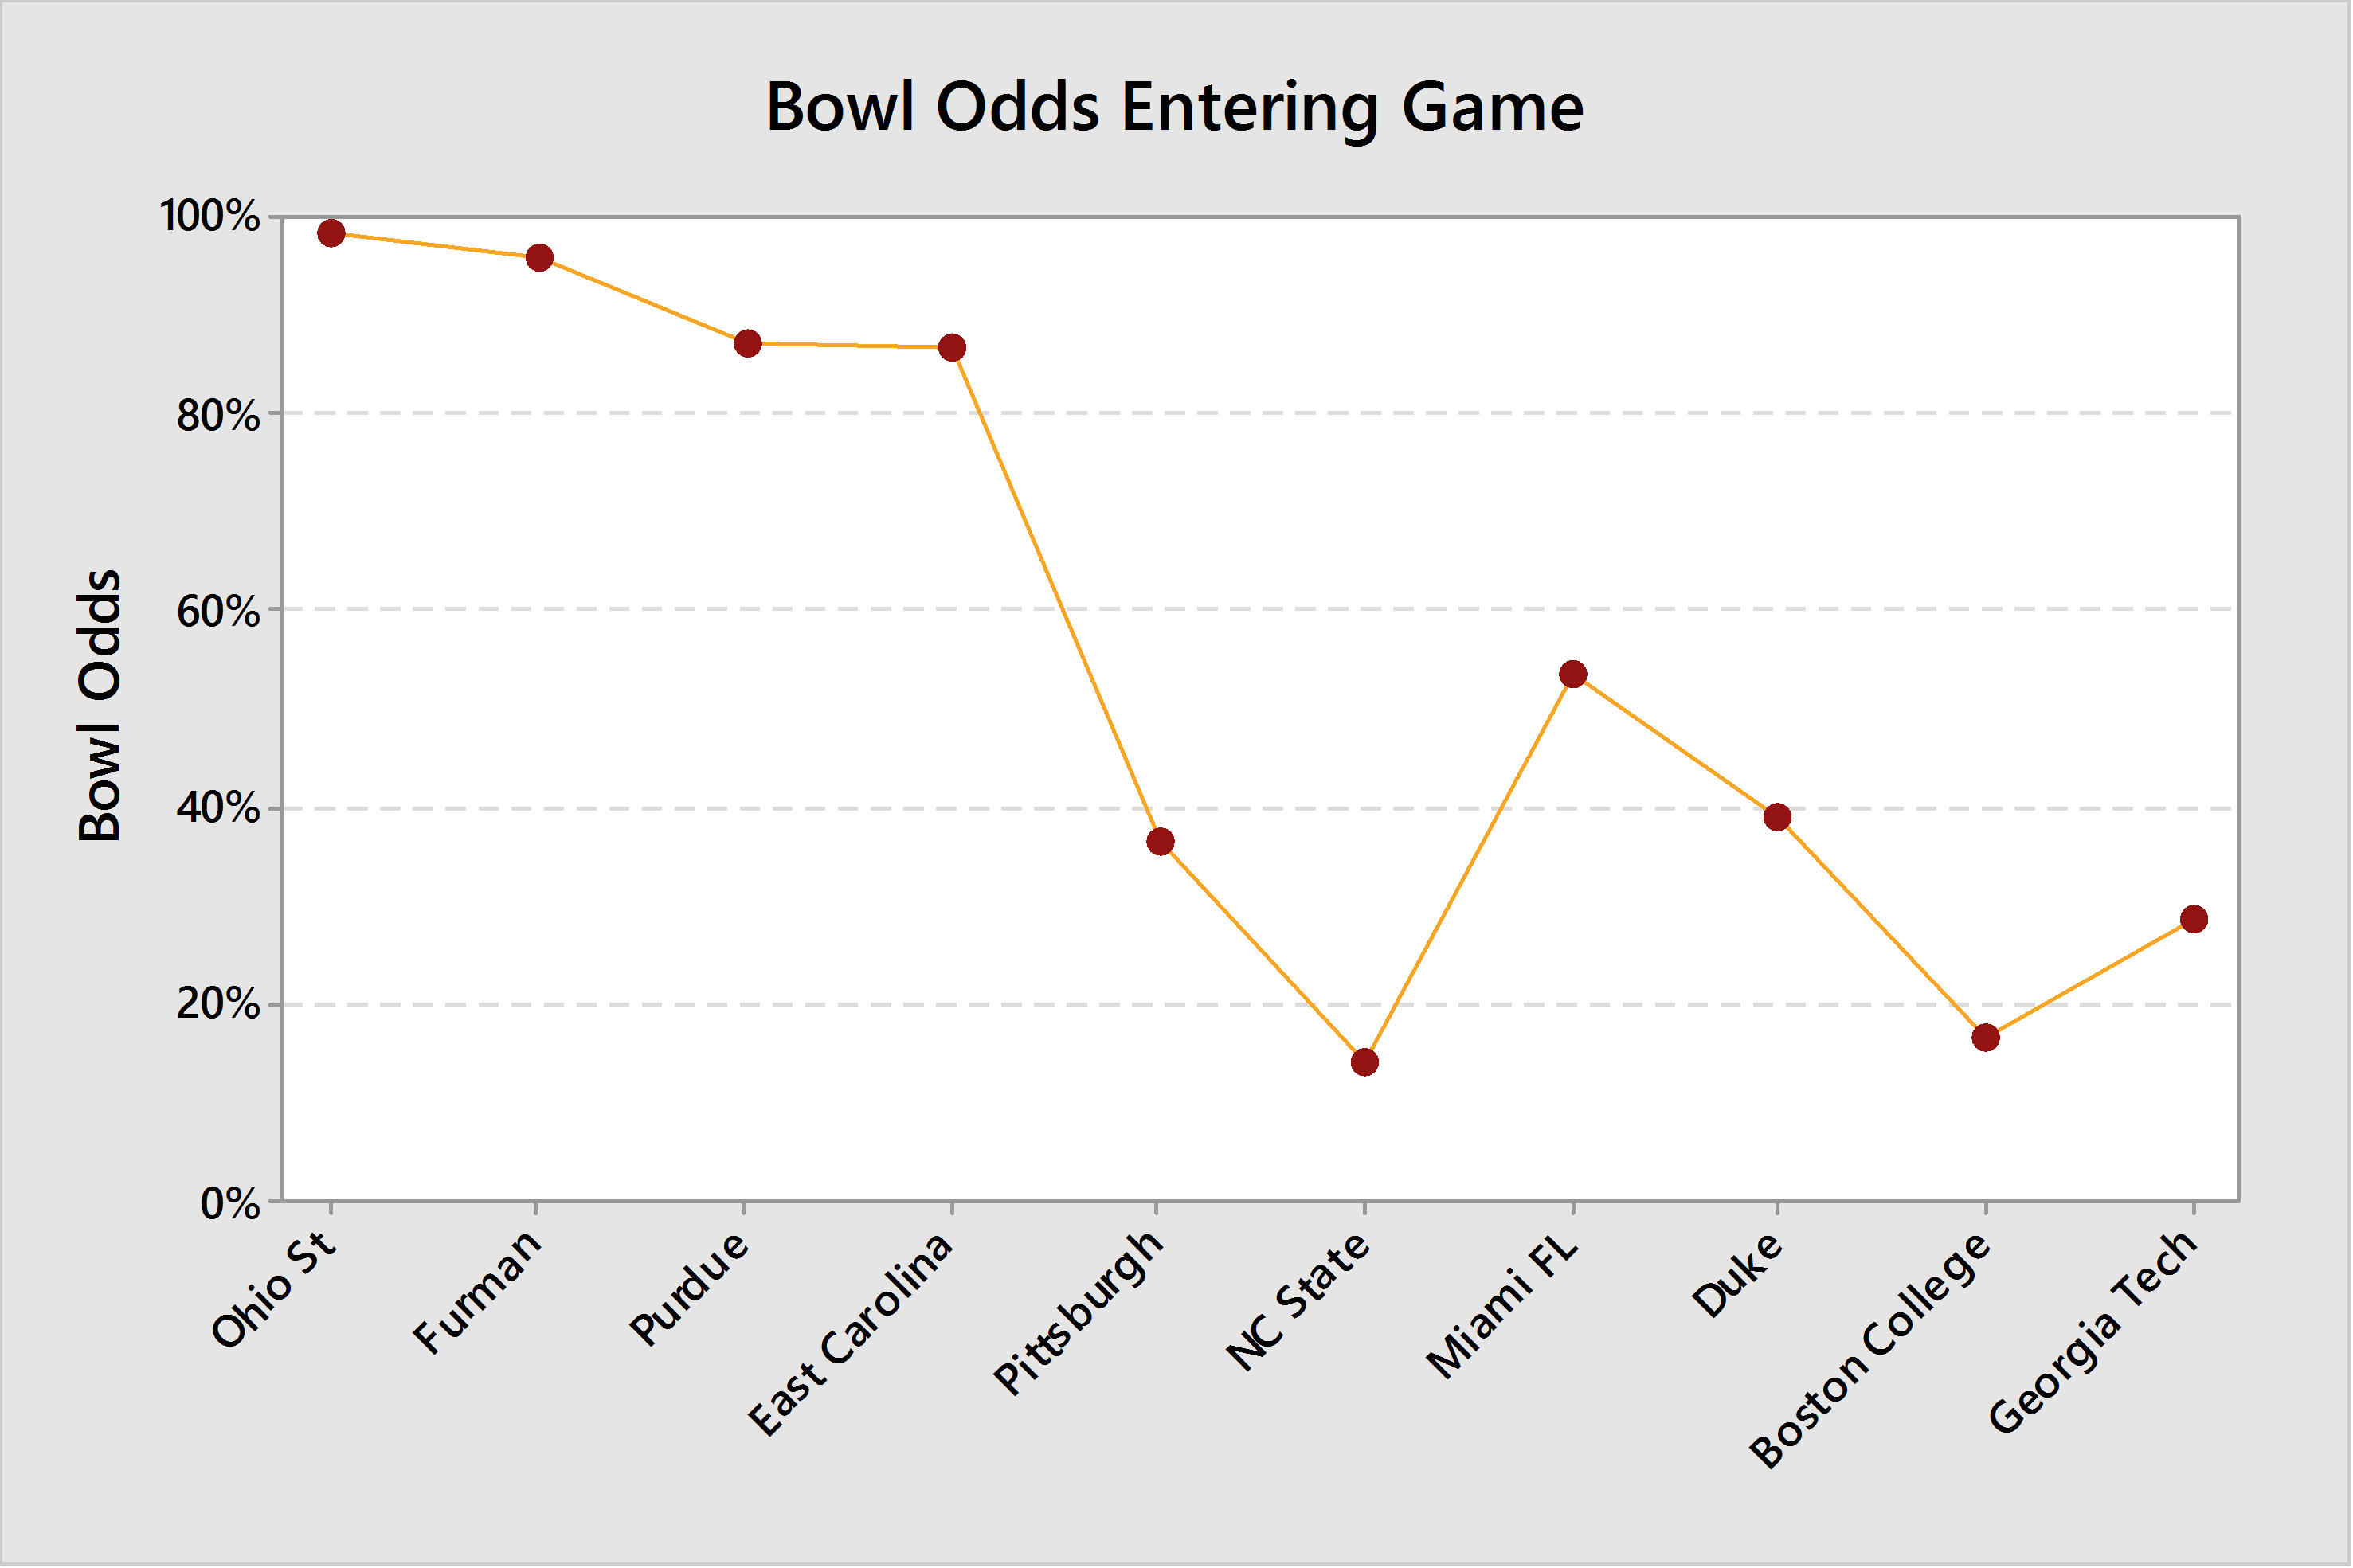
The win at Boston College has improved the bowl picture somewhat, although the odds are still firmly in the "streak will end at 22" camp:
Rankings and Computer Predictions
The computer rankings and predictions for each team:
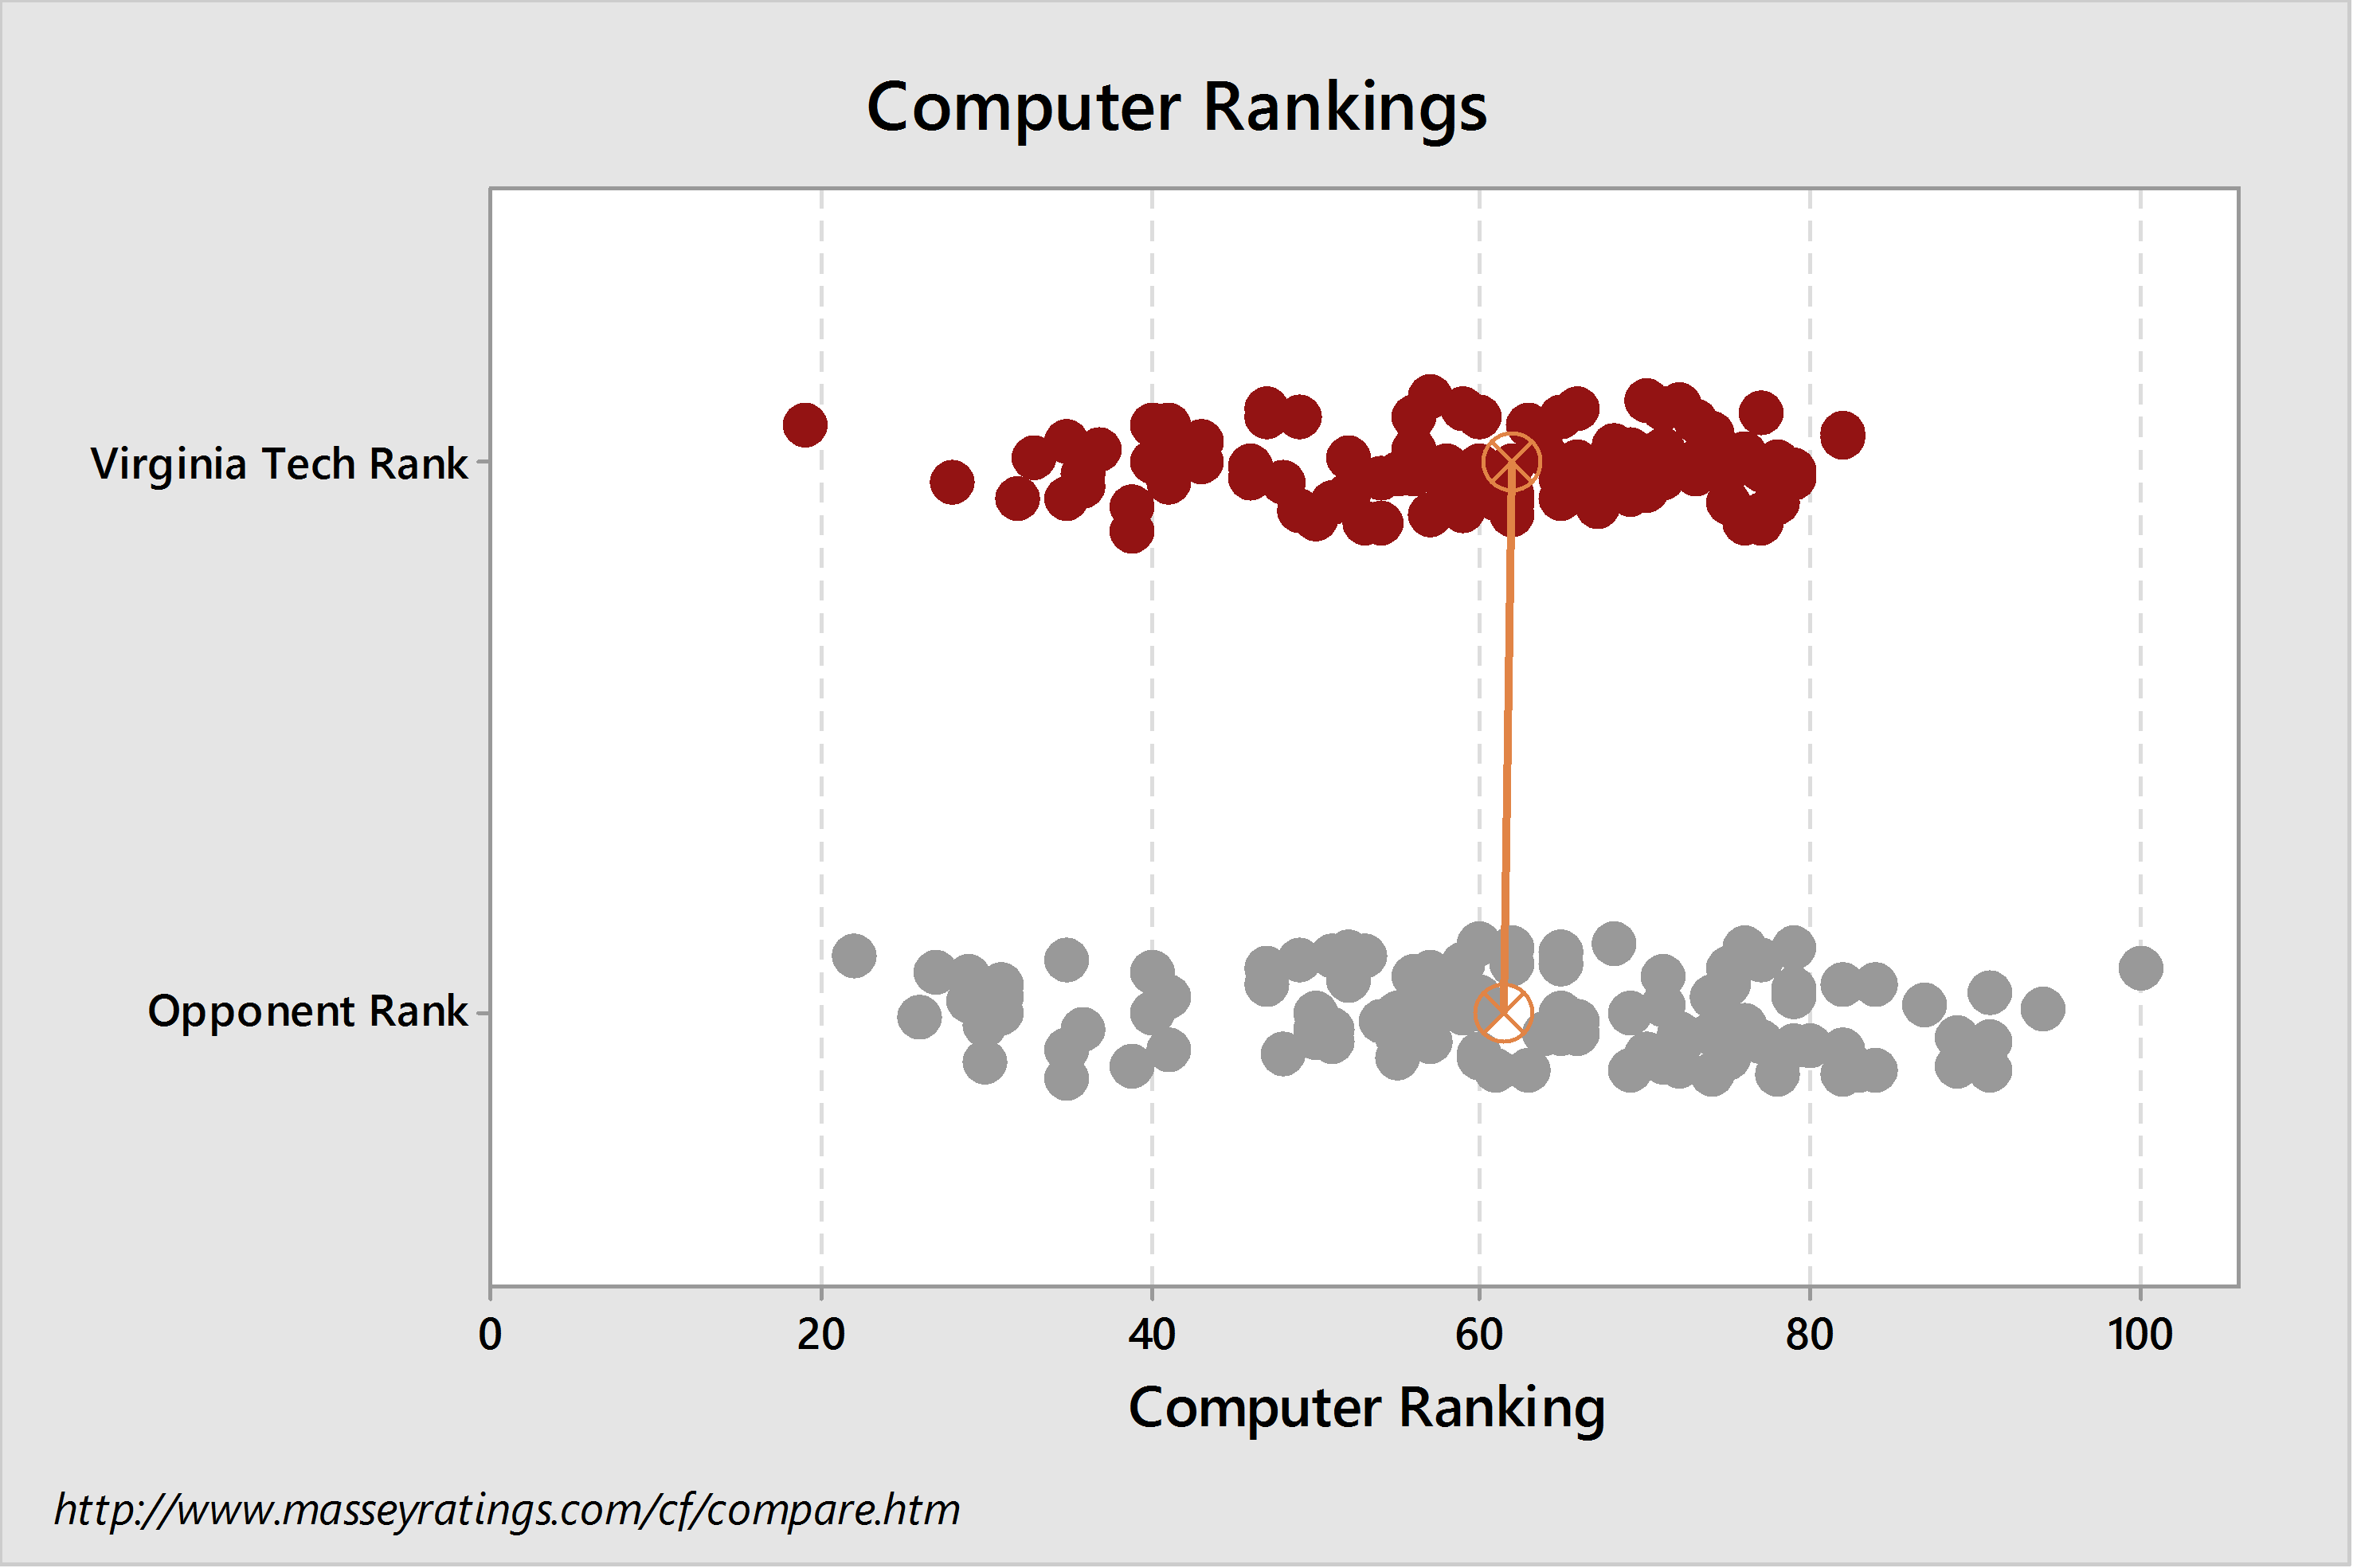

Both Techs began the 2015 season highly optimistic and planned on competing for the division title, and both have been very disappointed in how things have played out. They find themselves evenly rated, with the Yellow Jackets predicted to win by a few points almost entirely due to having home field advantage. The odds of a 3.5-point favorite winning are 39.6%.
Next is a look at any overall offensive or defensive advantages:

Just as the Hokies anticipated fielding a dominant defense in 2015, the Yellow Jackets seemed poised to field their most dominant triple option offense in years. Both have been disappointed, and find their respective units not much differentiated from the other Tech's.
When Virginia Tech Has the Ball
Here is an explanation of S&P+ ratings, and FEI ratings. All statistics are now opponent-adjusted.
Who has the advantage in the passing and rushing game when the Tech offense has the ball?


The Loeffler offense has found itself fairly average across the board, not particularly great at anything, but not inept either. Given extra rest after a physical Boston College defense and more time for Brewer to get healthy and into a rhythm again, it's very possible Virginia Tech outplays their rating moving forward. Further, the Bees have been poor at stopping the run thus far, and a healthy Travon McMillian may be primed for his best performance yet.
Offensive and defensive line performance are compared using Football Outsiders' metrics:
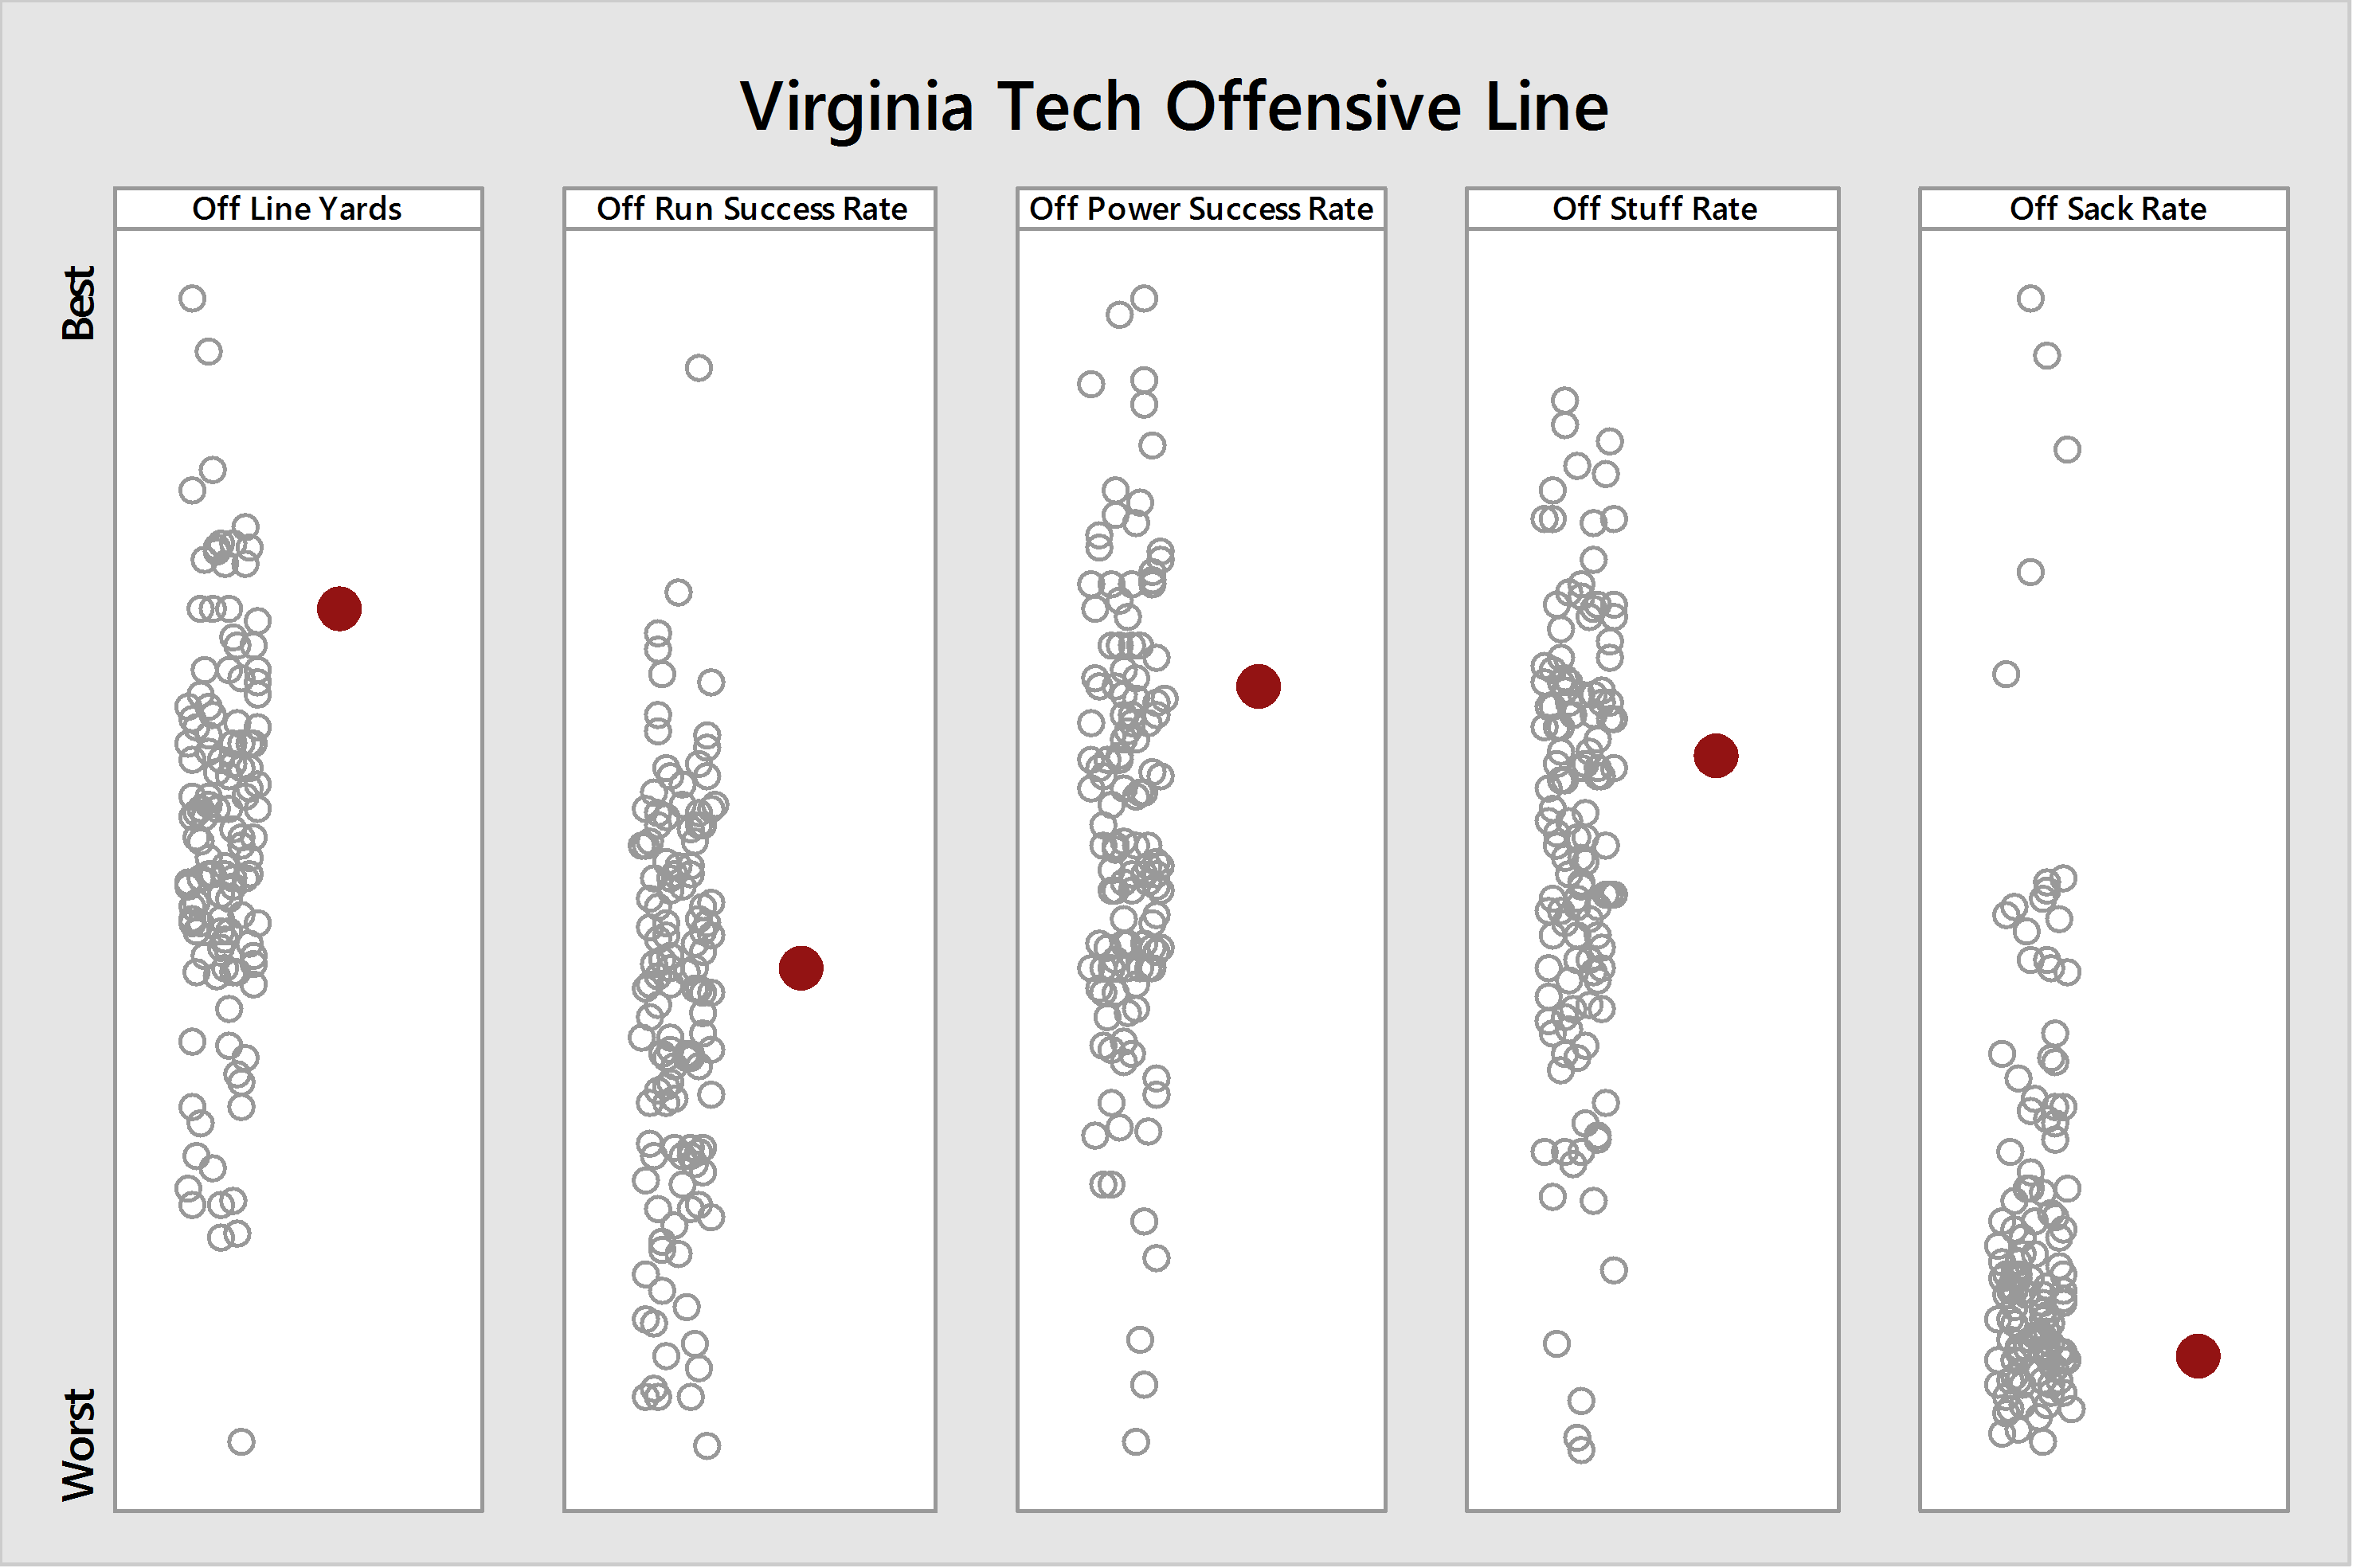
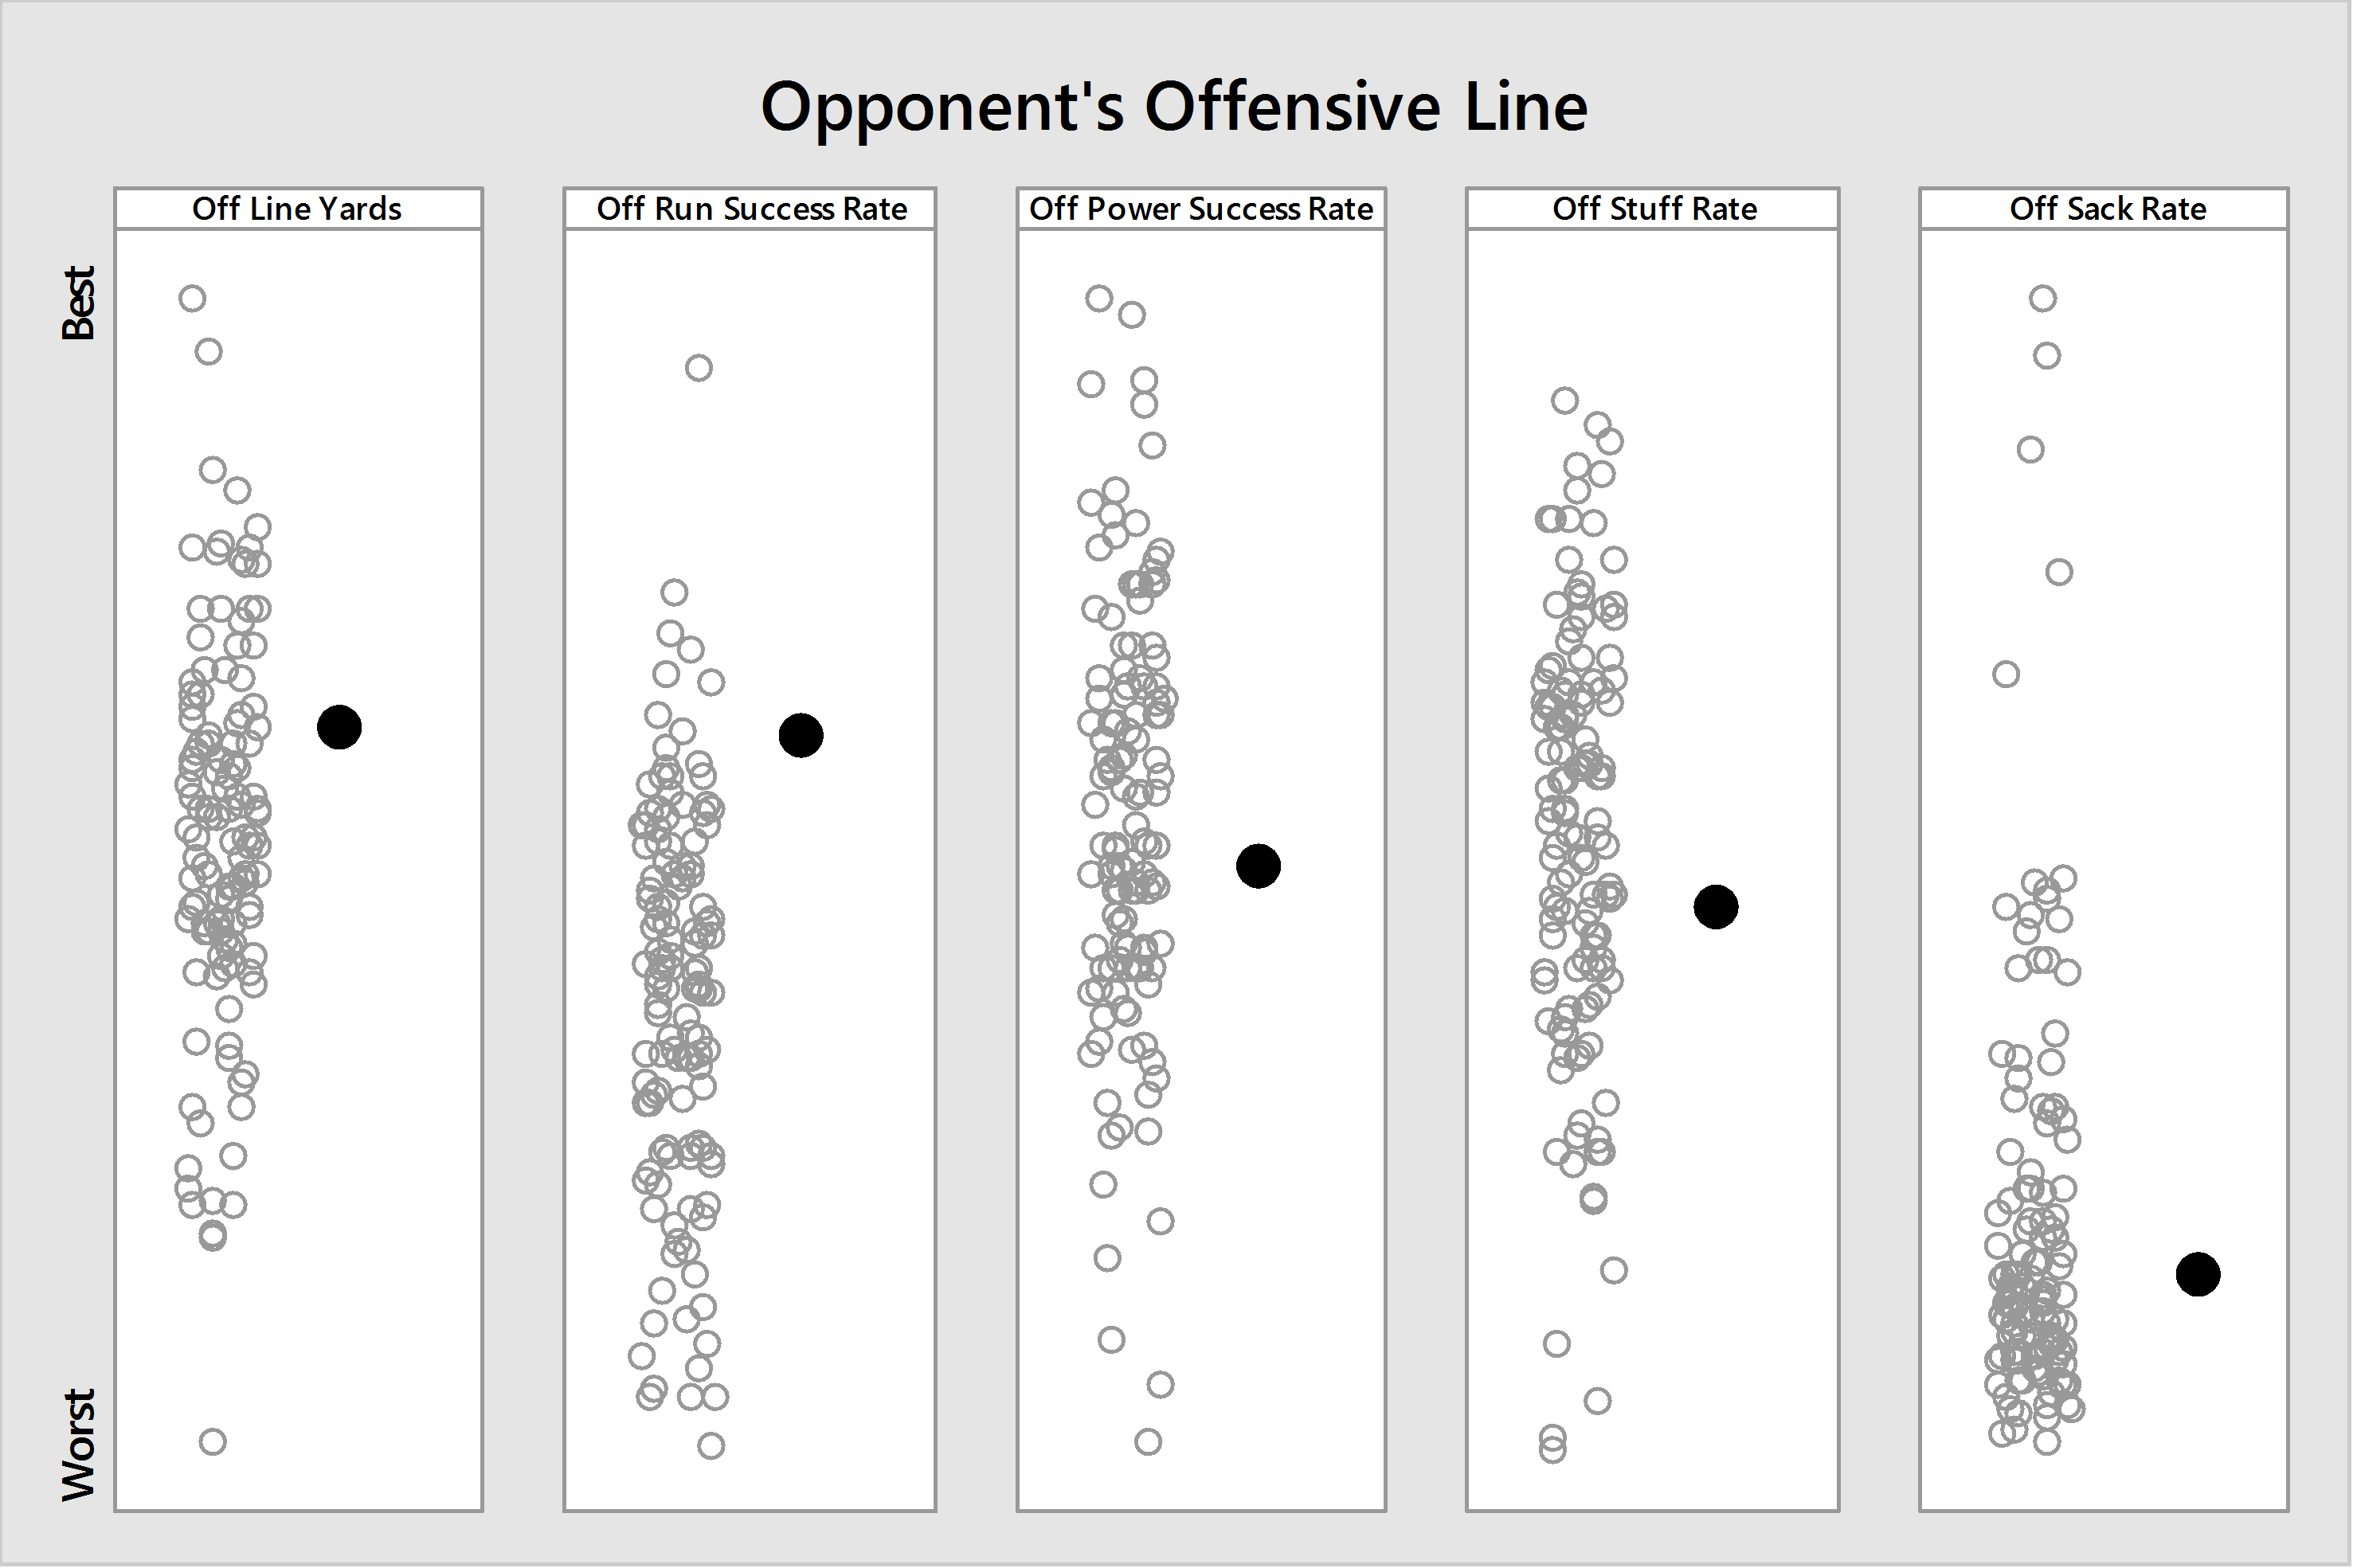
Lost in the obvious fact that the Hokie offensive line has not been very effective at protecting the quarterback from sacks, is the fact that they've been quite effective in creating rushing yards and getting enough push to be successful in power situations (3rd- and 4th-and-short). While the o-line may not be great, it's certainly not the liability it once was. Helping matters, the Georgia Tech defensive line isn't very good at any one aspect of the game, and sacks is the unit's weakest point, along with run success. Comparison of these units paints a picture of a very effective rushing day for the Hokies.
Now let's take a look at the FEI personality traits of the Hokie offense versus the Yellow Jacket defense:

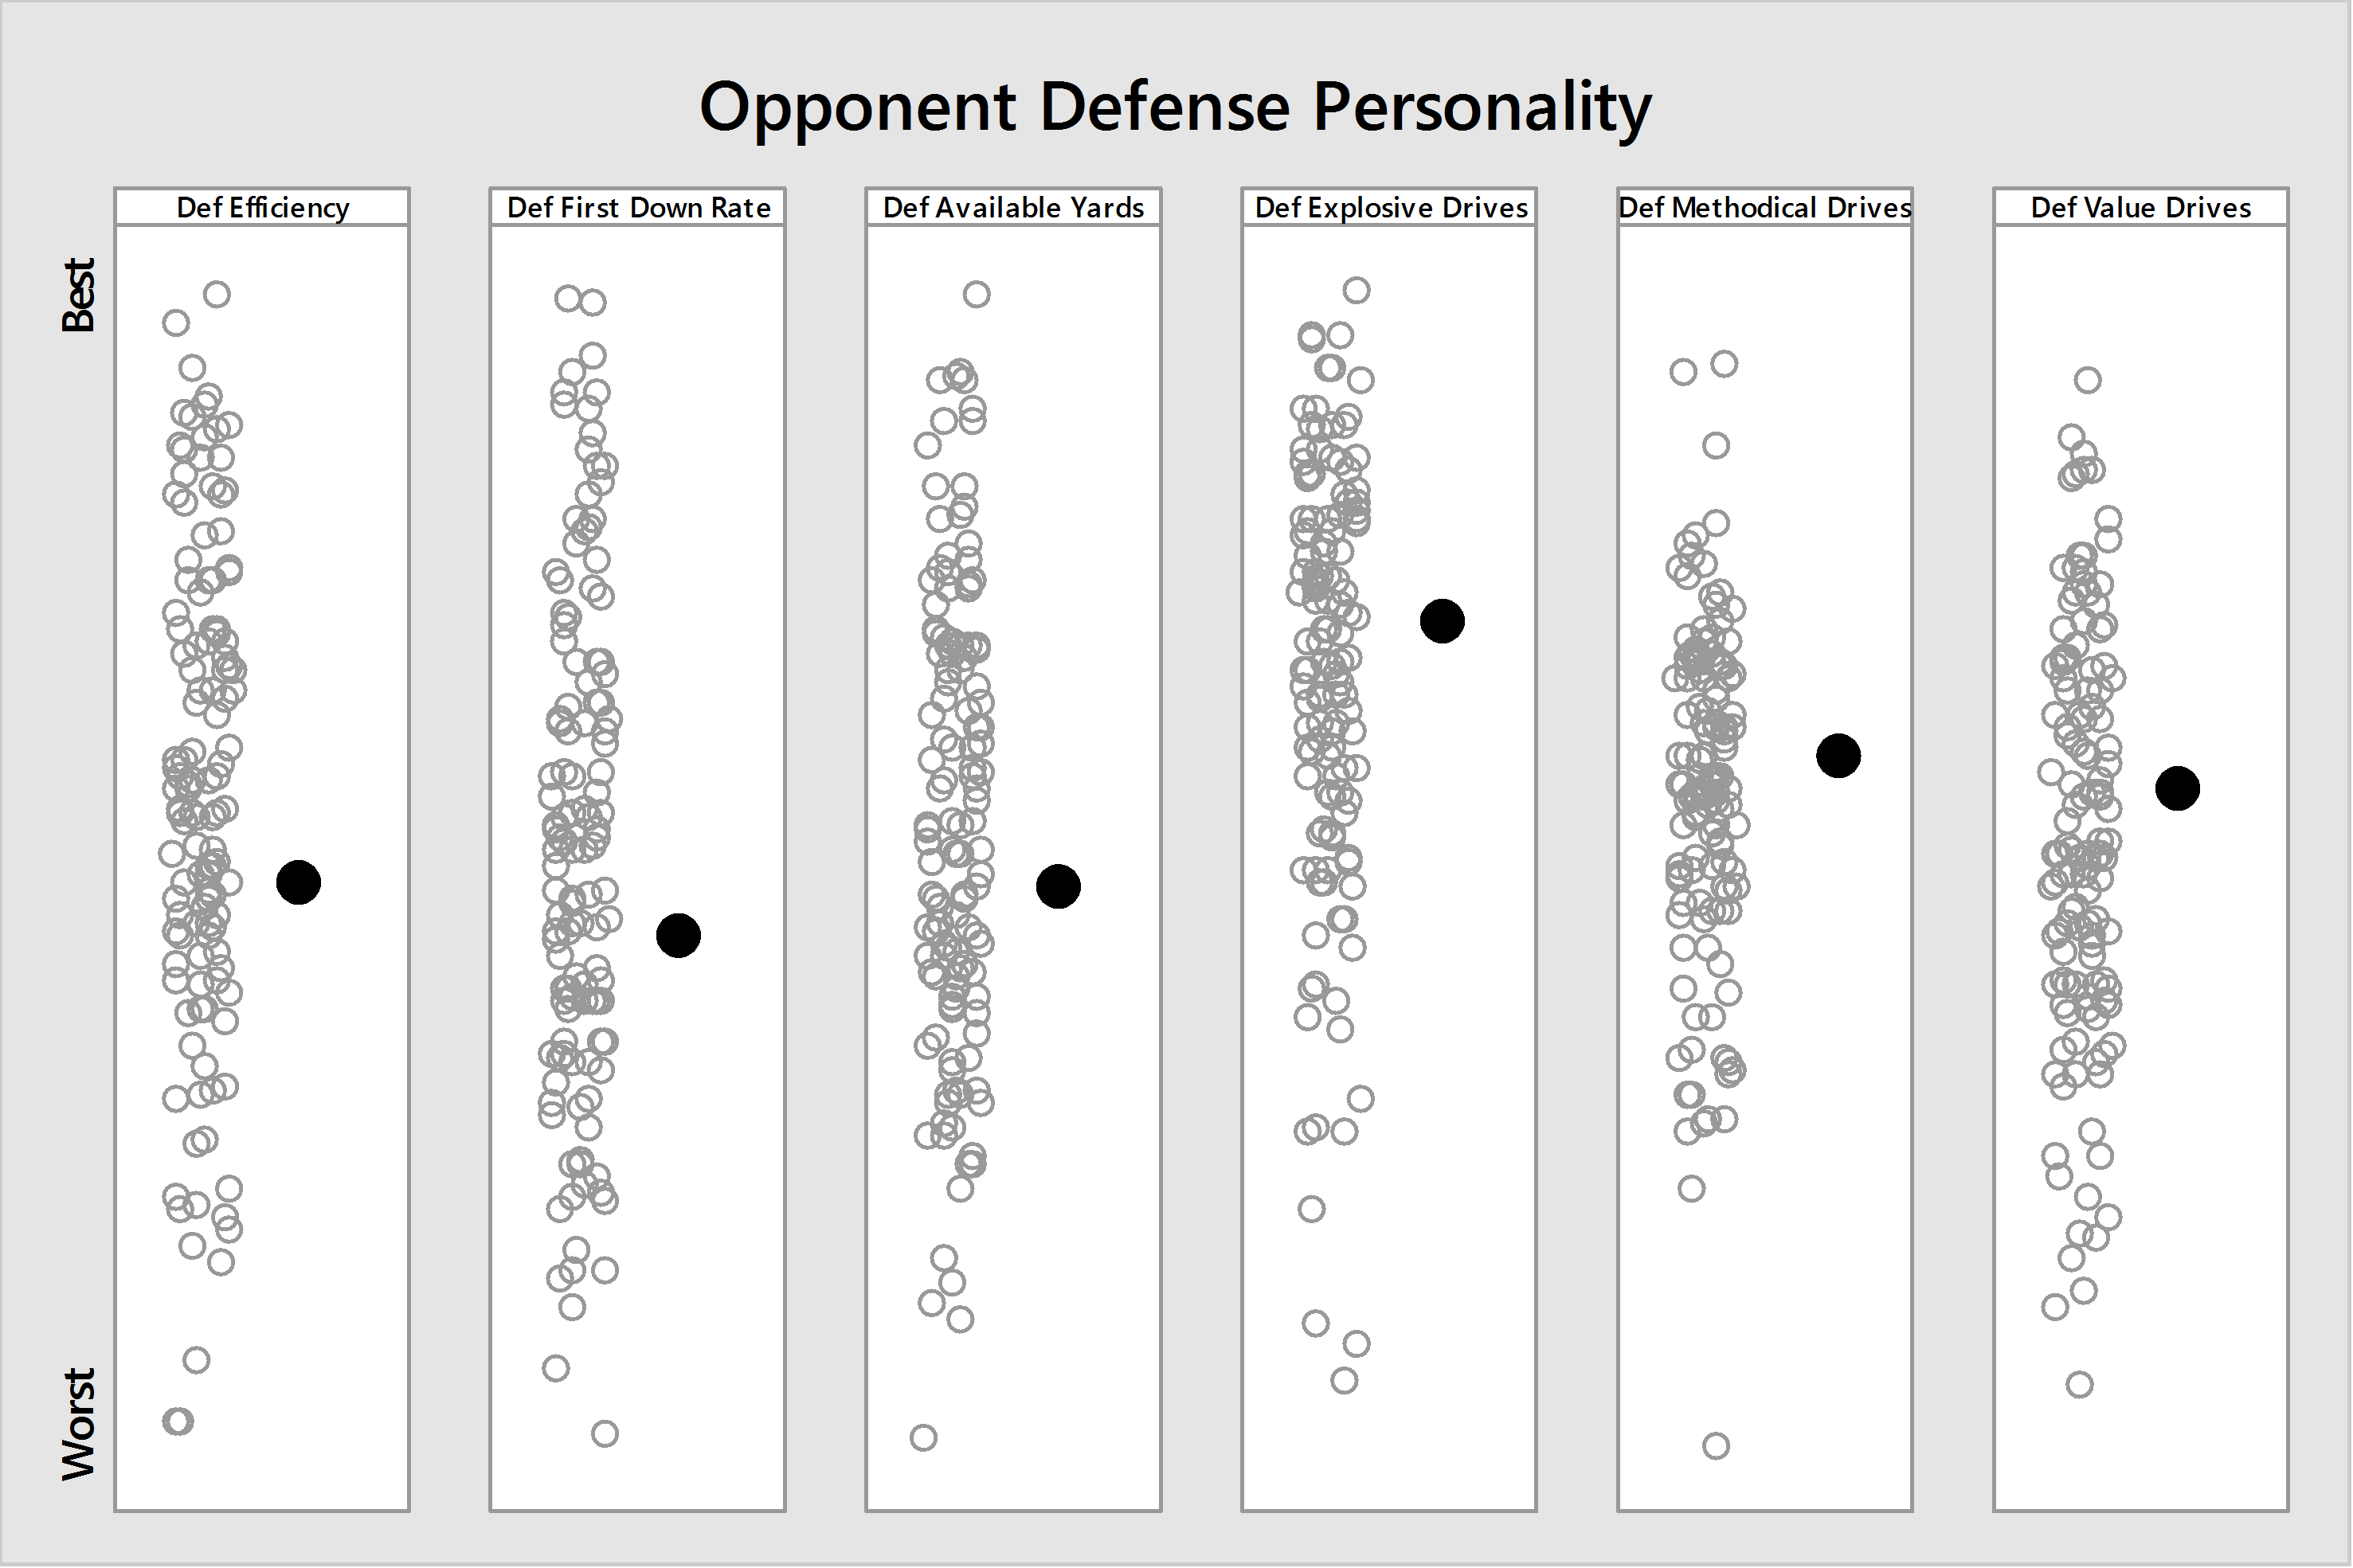
To summarize, the Loeffler offense isn't very good at being efficient or explosive or methodical, and it only gains a small percentage of available yards (the distance between where drives start and the end zone) despite having a decent first down rate (percentage of drives that gain at least one first down). Basically the offense may not go 3-and-out at a high rate, but certainly doesn't move the ball the length of the field often. The Yellow Jacket defense is average or a little below in all categories.
The FEI No. 75 Virginia Tech offense is closest in personality to:
- Army
- Georgia State
- Louisiana-Lafayette
The FEI No. 72 Georgia Tech defense is closest in personality to:
- Middle Tennessee State
- Ohio
- Tulane
When Georgia Tech Has the Ball
Again, examine pass-run comparisons first:

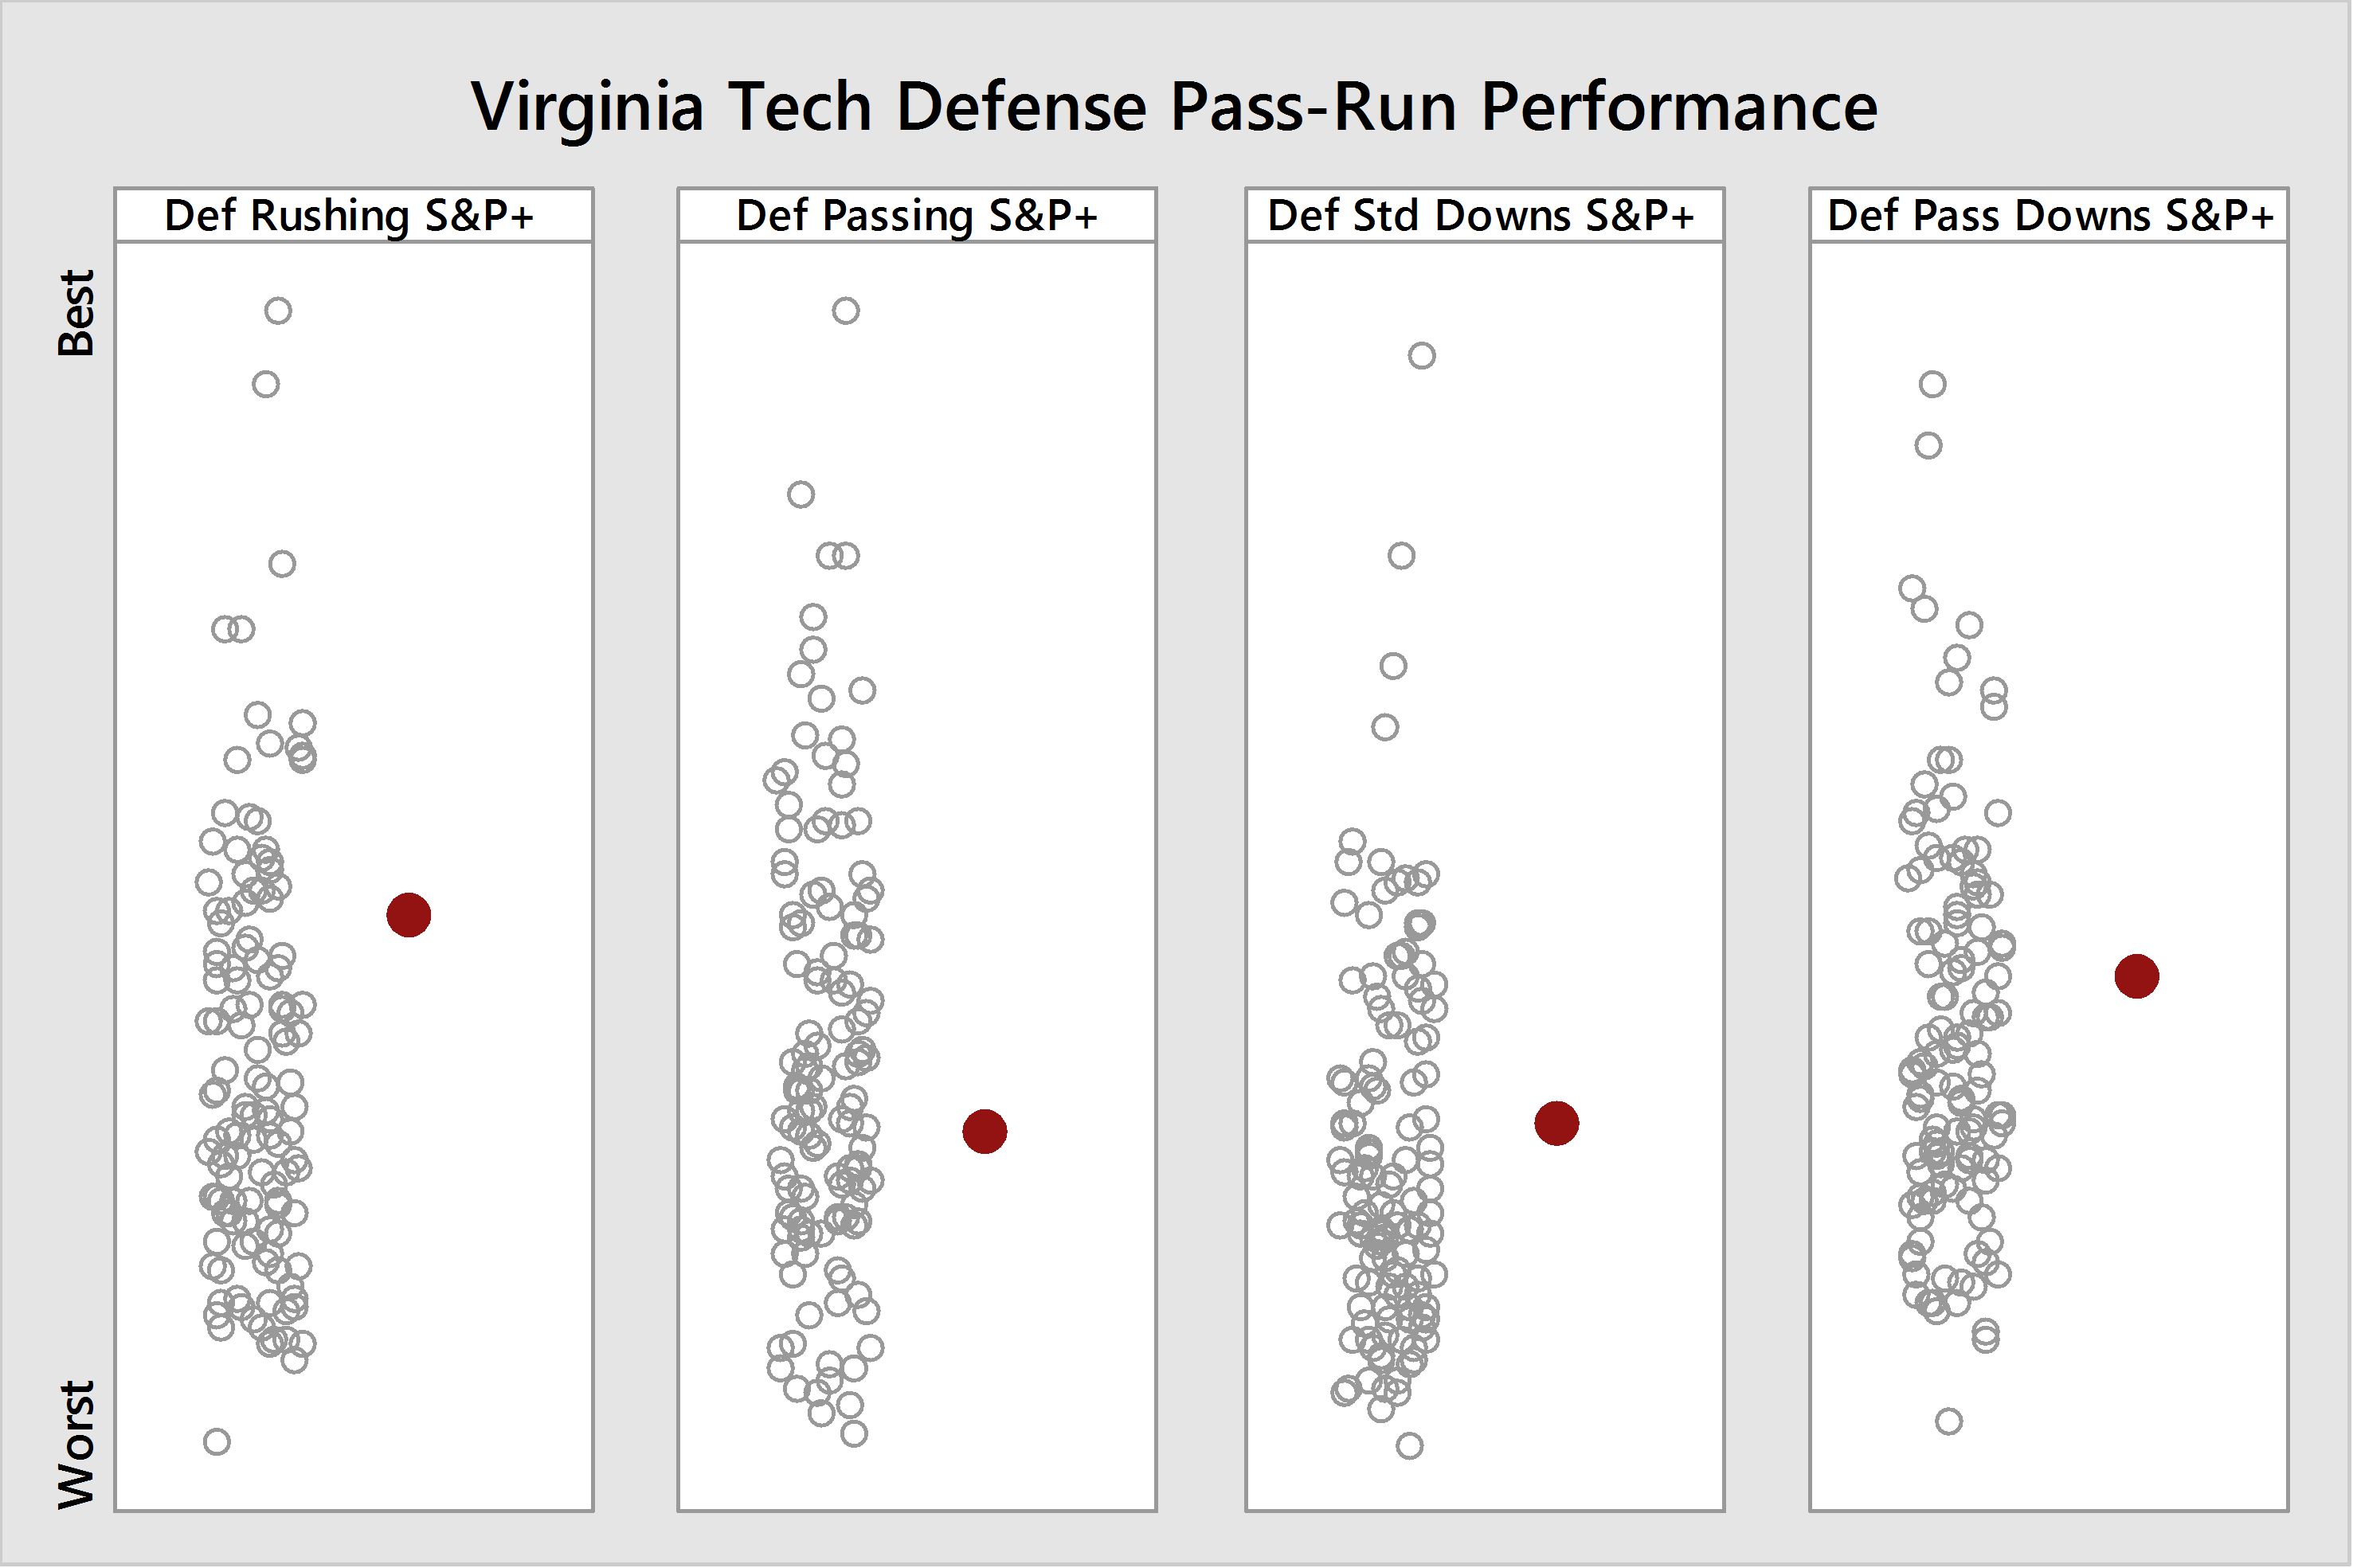
Of course rushing is the strongest part of the Yellow Jacket offense, but while the unit tends to rank in the top 3 in rushing annually, this season they have slipped to about 20th. Also, somewhat obvious is that while the unit can be effective on standard downs, on passing downs they are below average. Forcing the Bees to pass is a highly effective defense.
Offensive and defensive line performance are again compared using Football Outsiders' metrics:
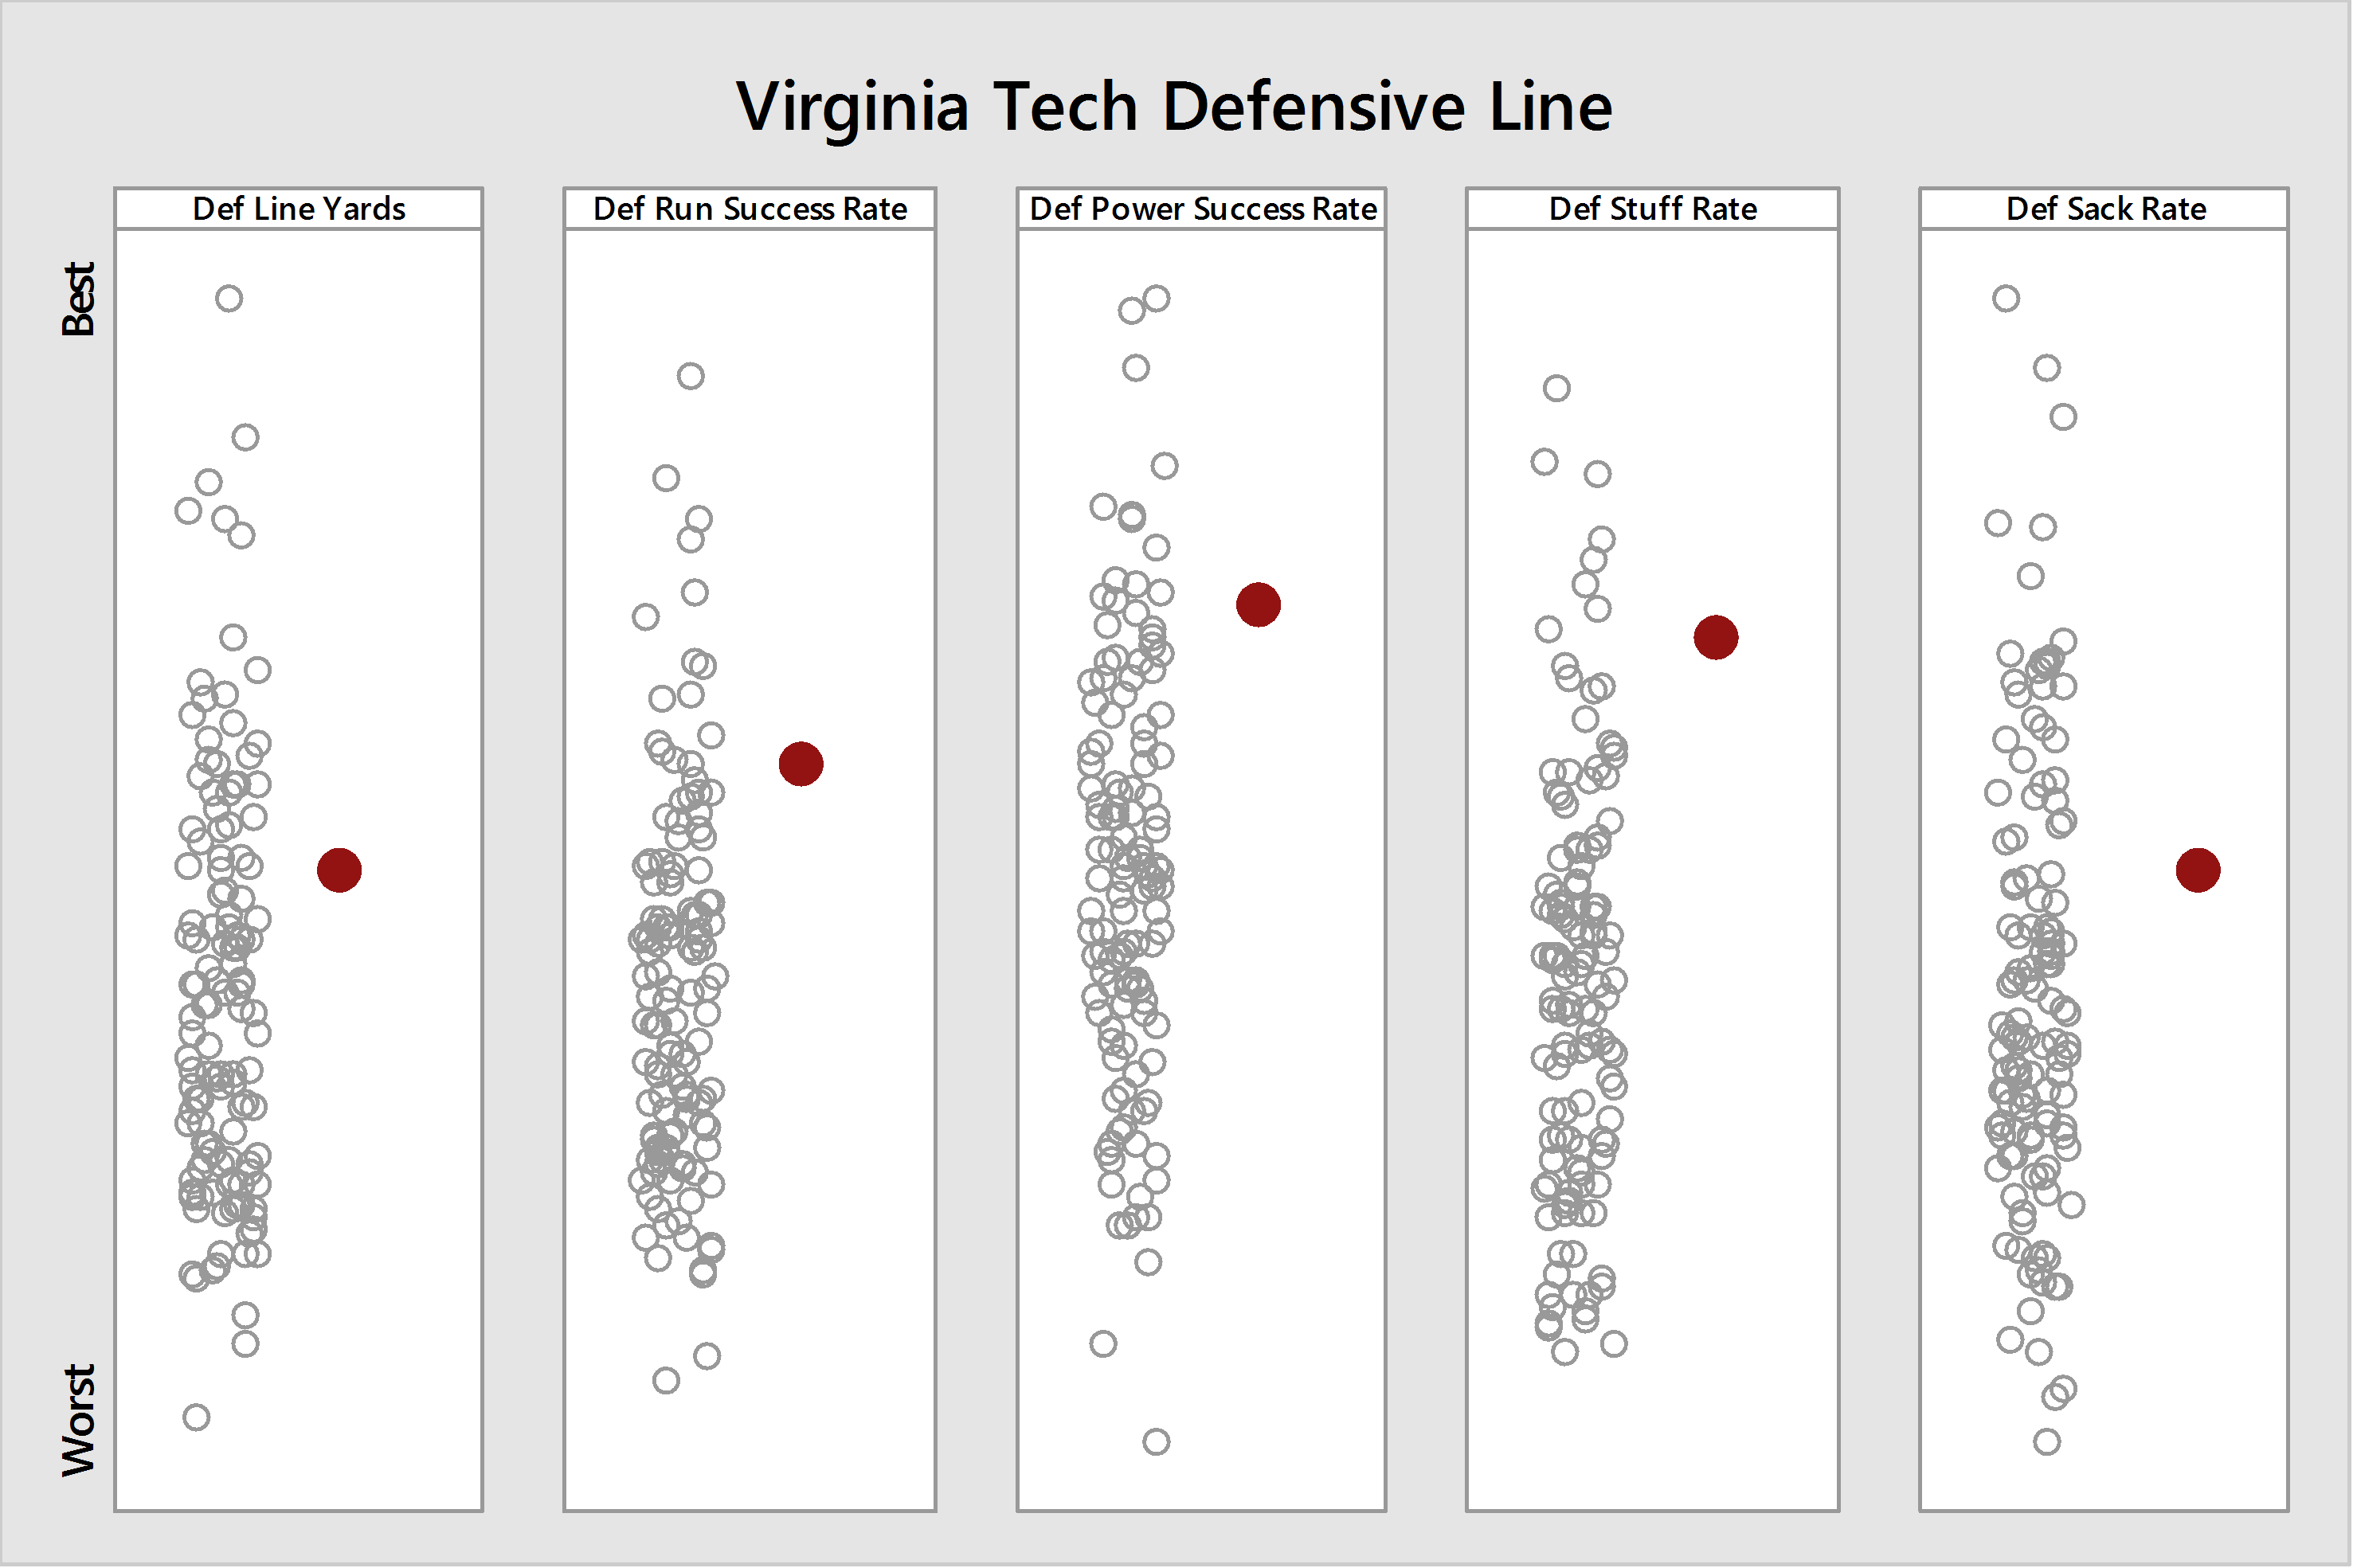

While the Georgia Tech offensive line has been good-to-great at creating rushing yards and success, the unit is surprisingly average (or worse) at converting in power situations. Typically having only 1-2 yards to go is almost automatic for the unit, but this season it has been far from it. Better for the Hokies, the unit has been very good at both limiting rushing success and stopping opponents on power plays, which suggests that the Yellow Jackets may not be the "death by a thousand cuts" fans are accustomed to.
As for personality traits:

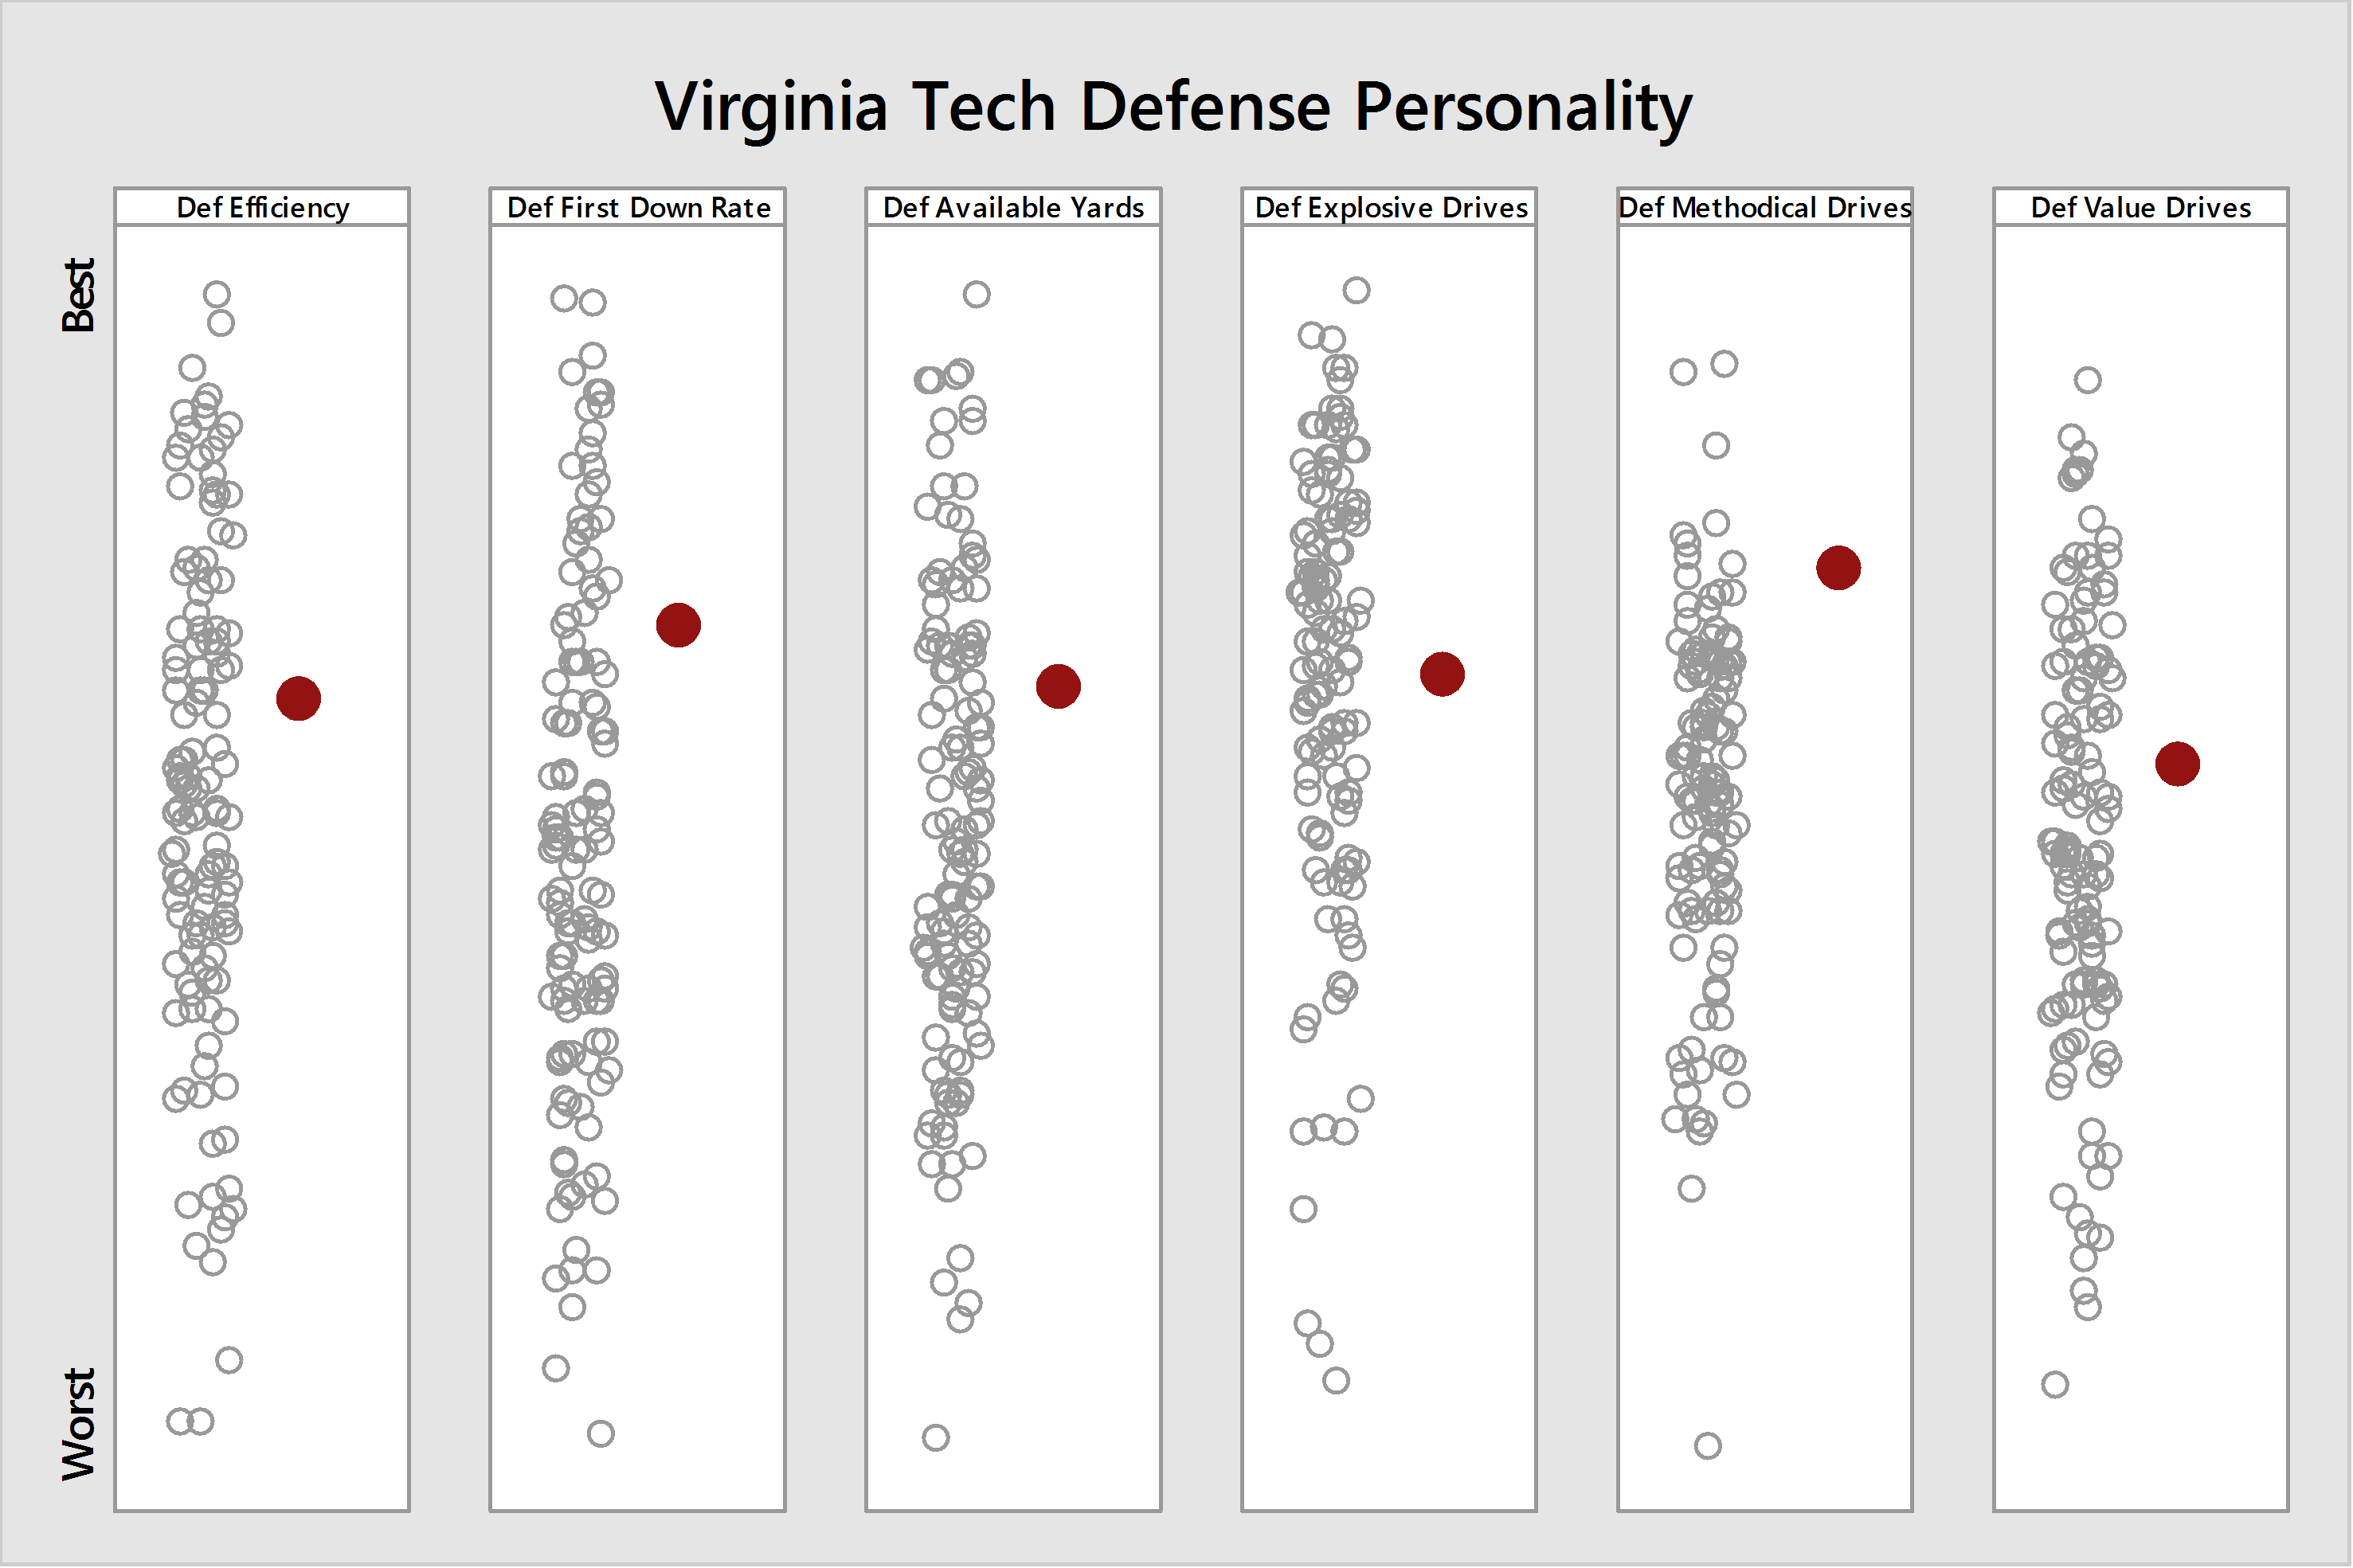
Georgia Tech's offense is fairly similar to the Hokie offense in its strengths and weaknesses. Its most notable characteristic being the unit is not among the best at methodical drives — almost a trademark of the typical Yellow Jacket offense.
The FEI No. 64 Virginia Tech defense is closest in personality to:
- Notre Dame
- South Alabama
- Wake Forest
The FEI No. 49 Georgia Tech offense is closest in personality to:
- Eastern Michigan
- Duke
- Texas A&M
Special Teams
First we look at the Hokies' kicking units:
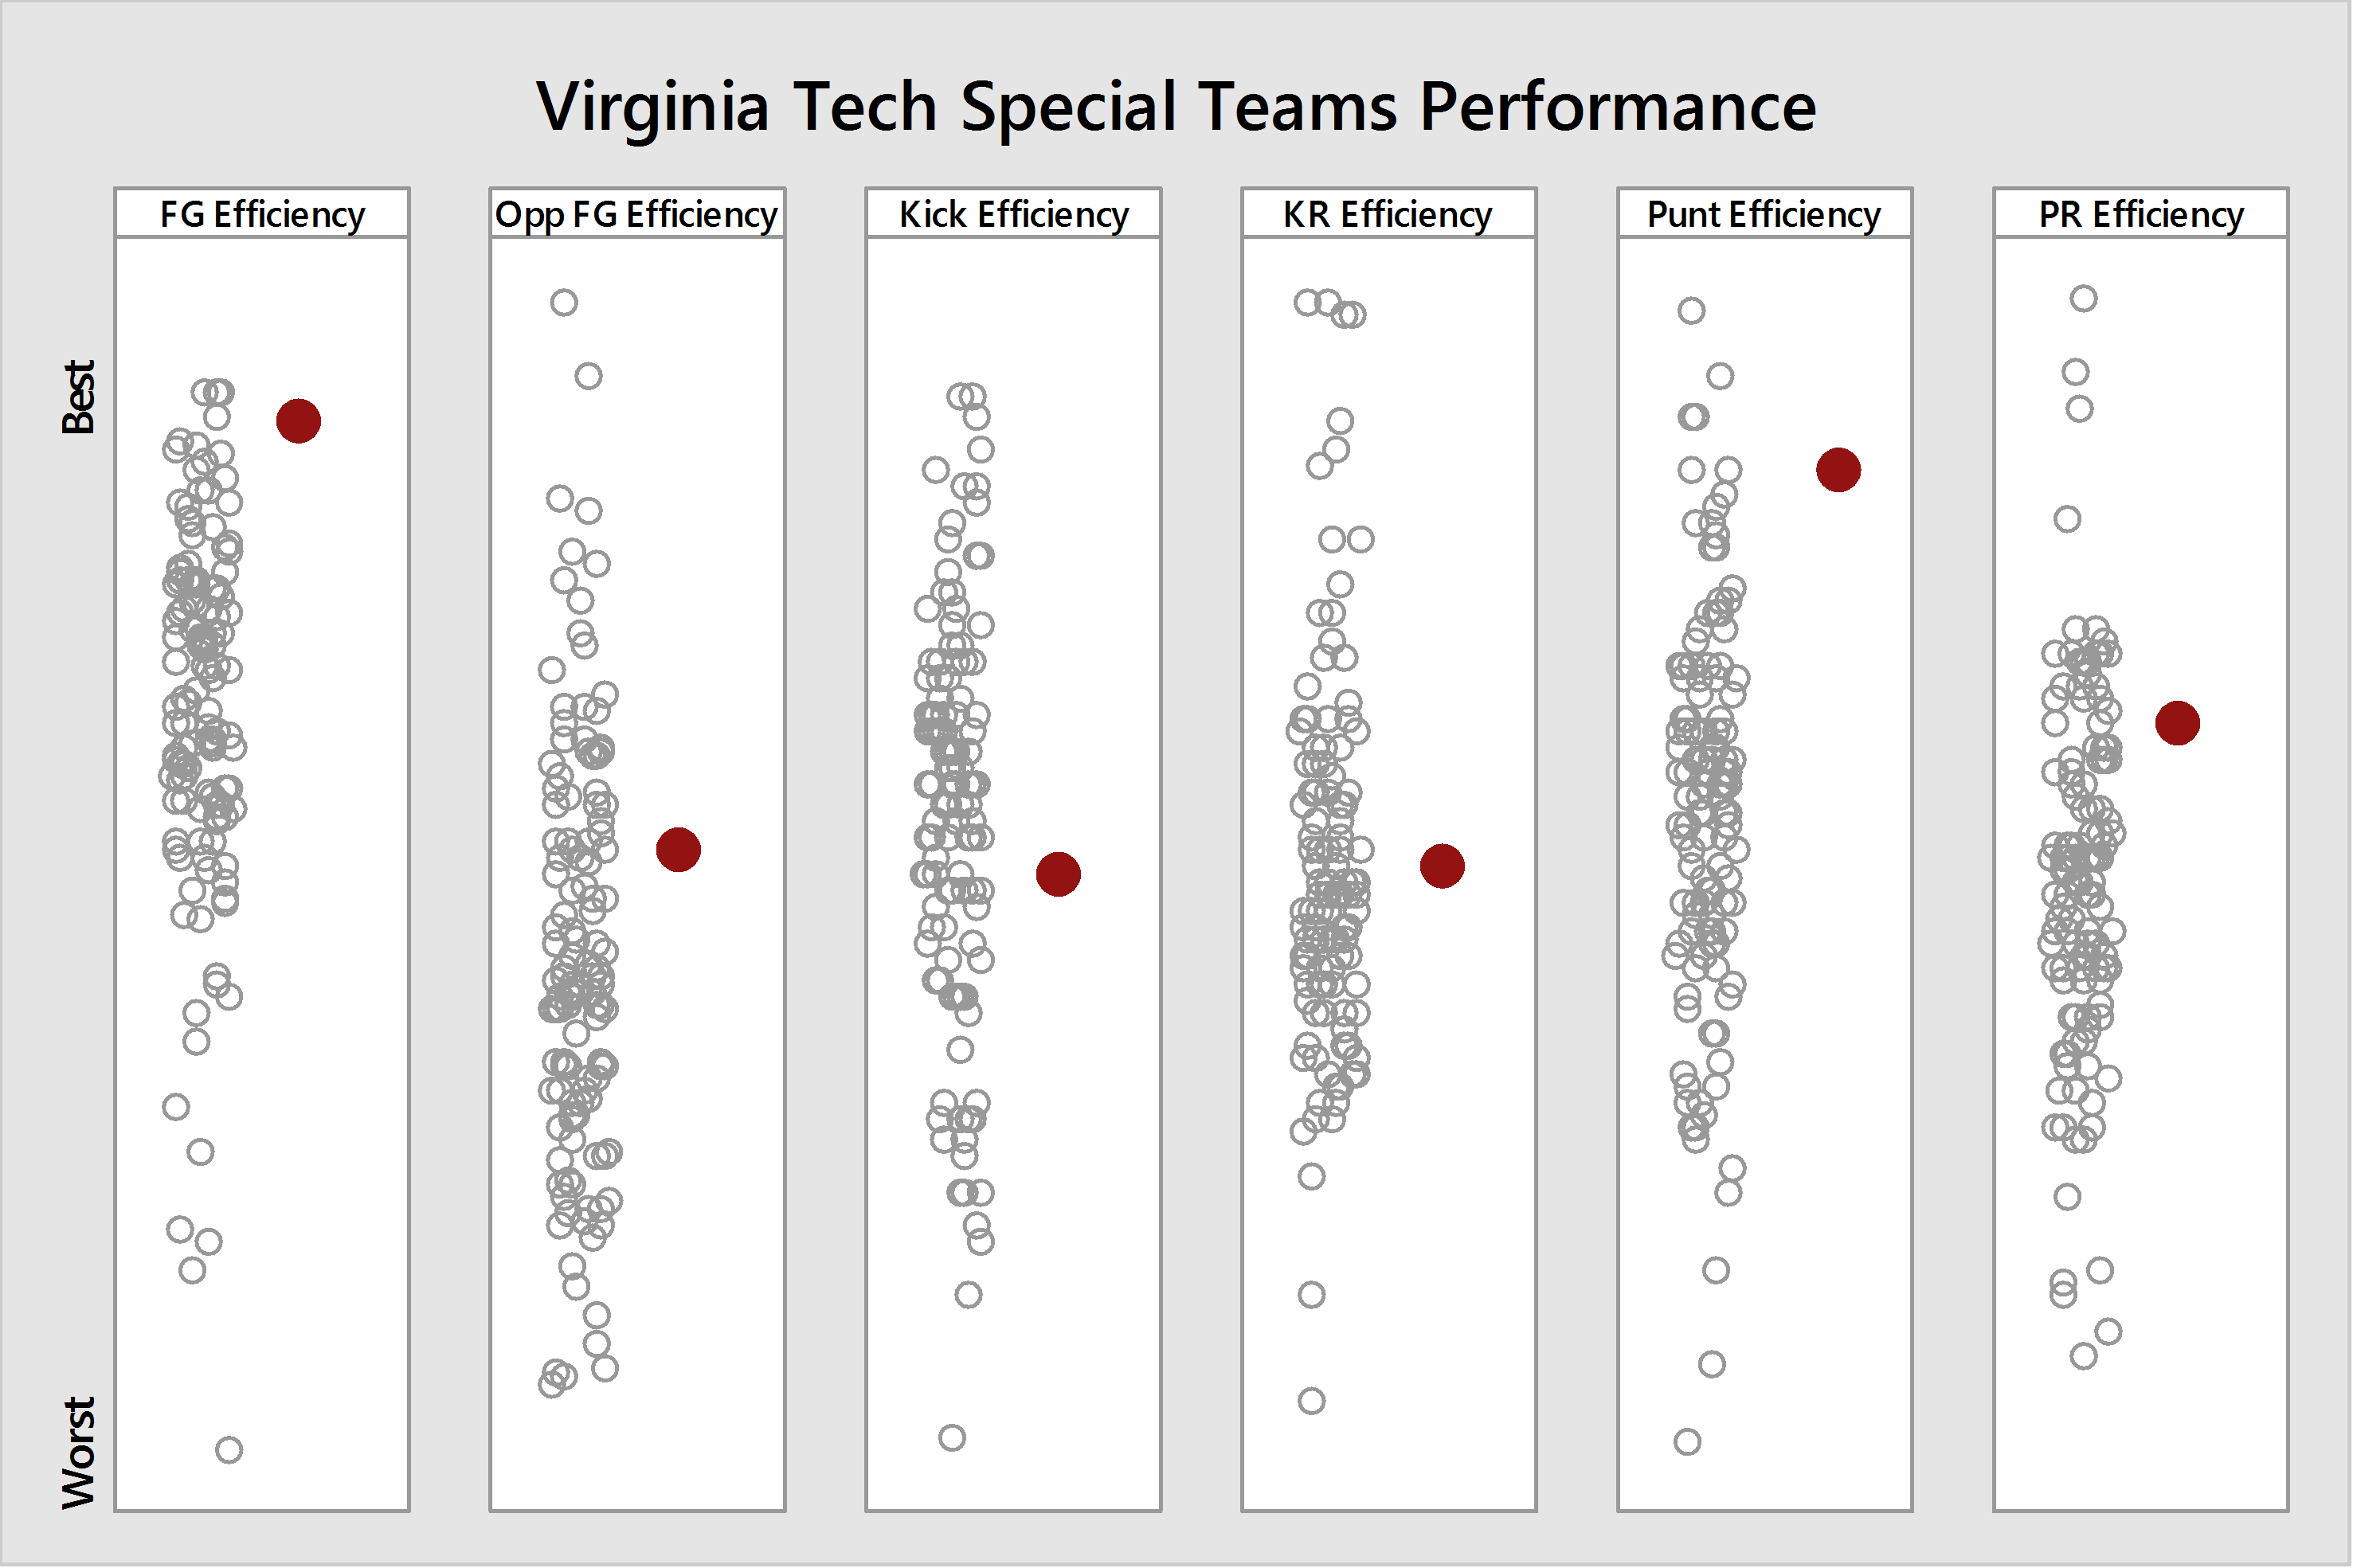
Currently FEI has Virginia Tech rated as the No. 1 special teams unit in the country. These ratings tend to bounce around each week, but that is a tribute to Frank Beamer in itself.
When the Jackets kick:

The Bees are also a good special teams unit, especially in field goal kicking. Puniting, however, leaves something to be desired.
Who To Watch Out For
- Quarterback Justin Thomas, the team's leading rusher in attempts, and someone many thought could enter the Heisman discussion before the season started. Thomas is effective at the option and gets to the second level regularly. As a prototypical Georgia Tech QB, he is also completing just 43% of passes on the season. Additionally, he has fumbled 9 times on the season.
- WR Ricky Jeune, who catches just 40% of balls thrown to him (keep in mind however, most throws are coming in obvious passing situations and heavily defended), but gains over 21 yards per reception.
- Punt returner Jamal Golden returns nearly 50% of punts for almost 13 yards per return.
Statistical Insights and Prediction with Matt Mills
I asked Matt Mills of Football Study Hall and From the Rumble Seat what statistic best defined Georgia Tech's season to date and would likely determine the winner of the 2015 Techmo Bow. His in-depth response follows in the below section:
This biggest thing for me has been third downs. Last year we ranked first in the country in third down percentage but this year we rank 122nd. 122 out of 128, this makes me so mad. But why are we so bad? Let's do some digging. The following plot shows the year to year change from 2014 to 2015 for all FBS team's 3rd down conversion percentage and also the average distance they faced. The arrow points from 2014 to 2015. I've highlighted GT in gold and VT in that gross color of y'all's ;)
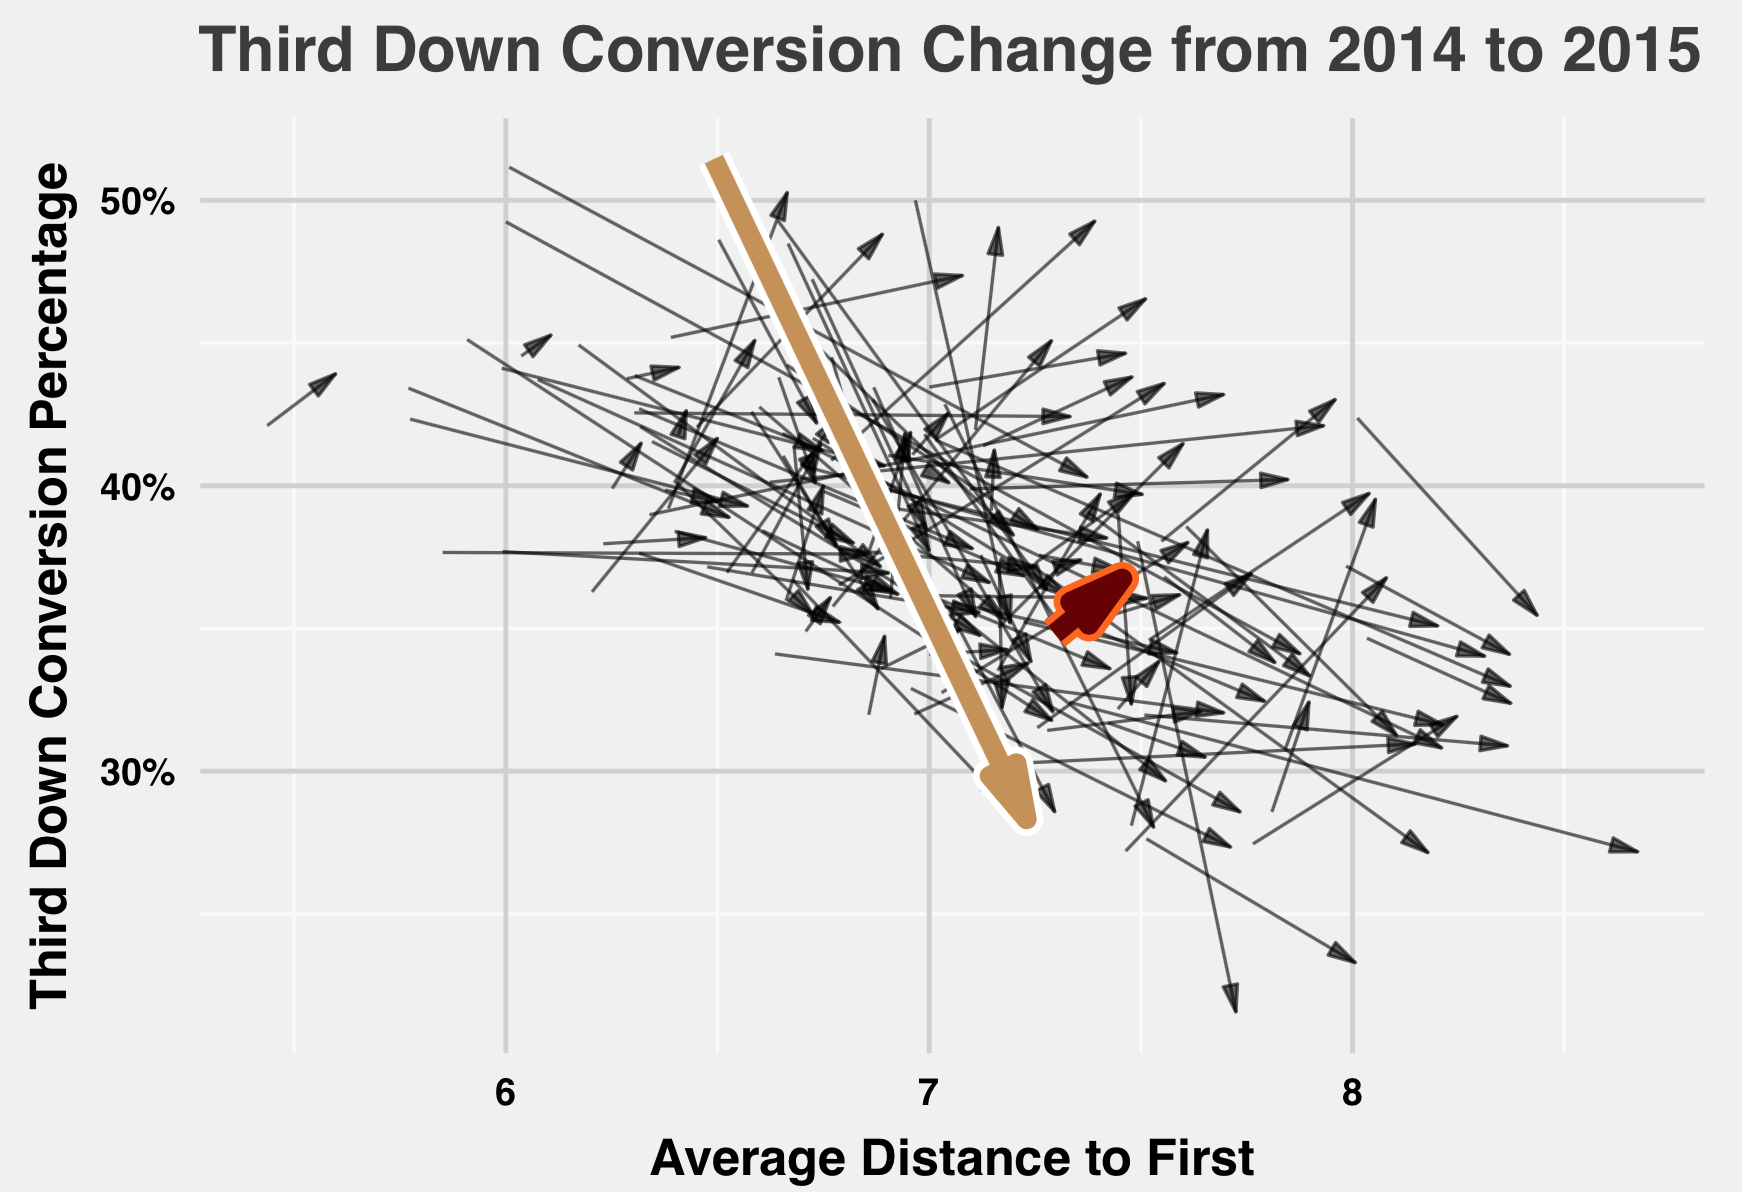
Georgia Tech went from a top team to one of the worst. Also we went from facing an average of 6.5 yards to go on 3rd down to facing more like 7.25. In 2014 we were 25th in the nation in this metric but in 2015 we are 70th so far. But if you notice the trends of the arrows it is naturally harder to get a first down the farther you are from a first: we should expect some difference. However, as the drop off that Georgia Tech is experiencing is ridiculous. I made a model that estimates the likelihood of a first down conversion based on the distance to a first for all third downs in the 2012 and 2013 seasons. I then used that to predict the probability of converting each 3rd down in the 2014 and 2015 seasons and found how successful teams were at converting third downs more than expected. I then found the change between team's 2014 and 2015 ability to convert third downs over their expected number of conversions based on the distance to a first. For example, in 2014 Georgia Tech had 89 third down conversions but we would be expected to have only have 70 based on each third down's distance to go. I normalized this to a per third down opportunity so that we can compare the years better. In 2014 Georgia Tech basically gained an extra third down per 10 third downs faced, while this year we are basically gaining one third down less than expected per 10 third downs. This drop (from 3rd in the nation to 126th) is the largest drop in the nation. Here is a chart showing the changes between this year and last year for every team in the ACC, with again the arrow pointing from 2014 to 2015.
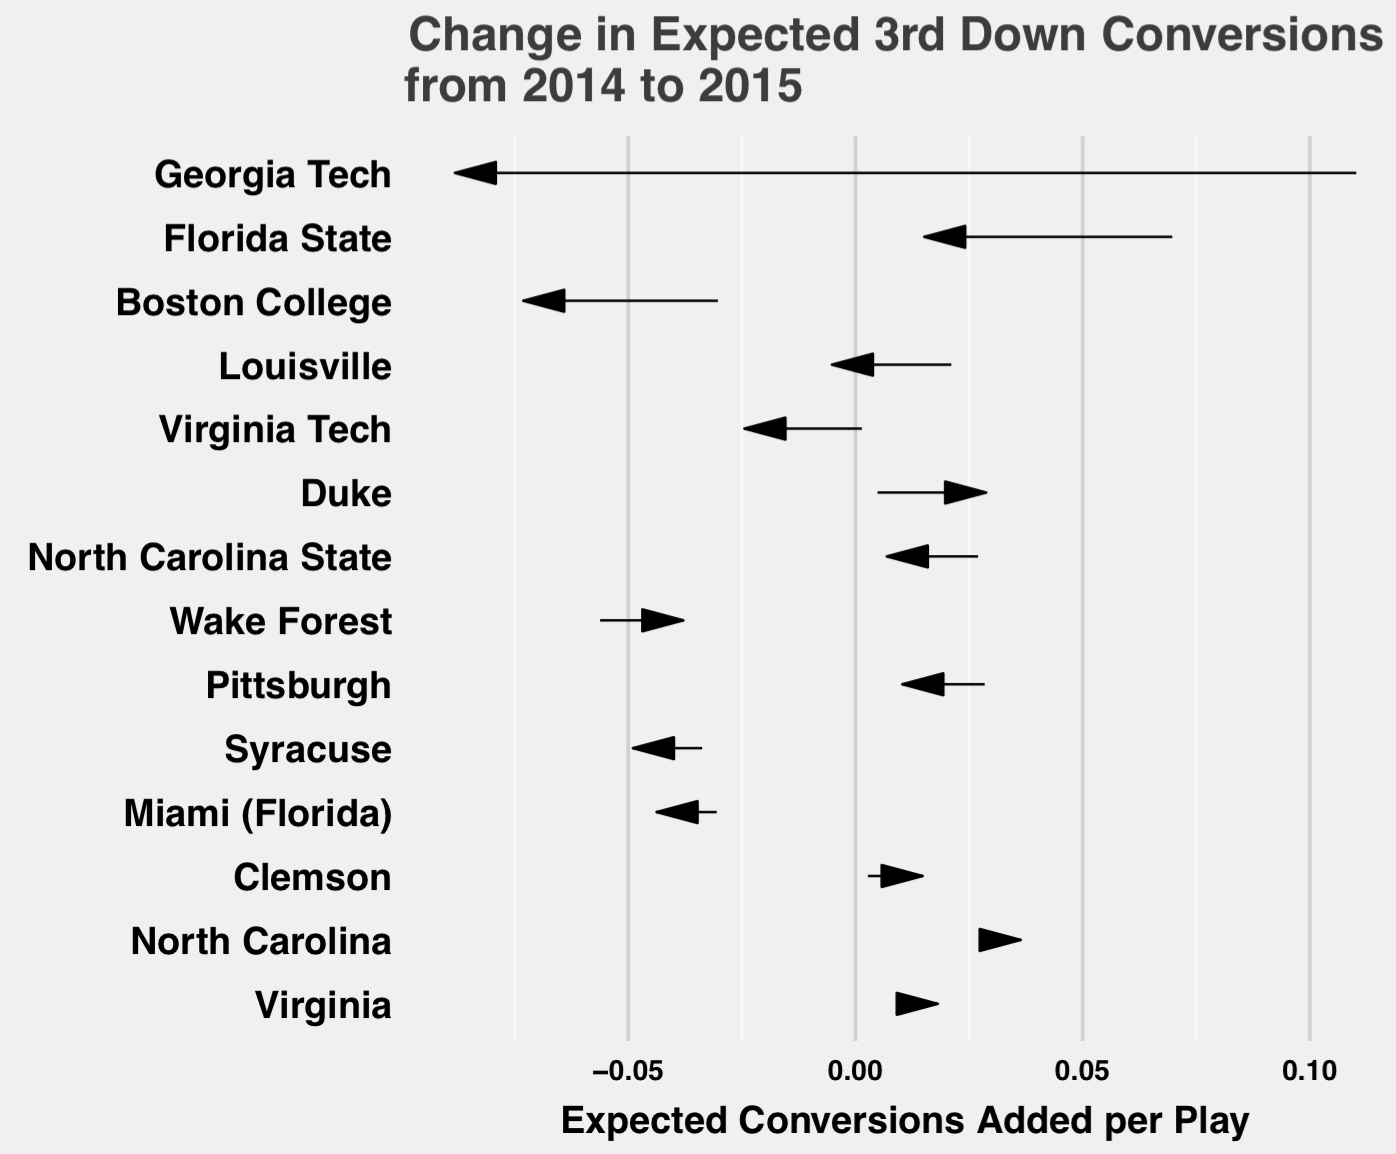
So not only is Georgia Tech facing harder to convert 3rd downs we are also sucking at converting them given how far we have to go. Not. A. Good. Combination. As to why all this is happening, I'm not sure it's anything other than our offense is just not as good. Last year we averaged 6.7 yards per play on third down, this year it's 2.8. The change in yards gained rushing (5.2 to 2.3) and yards gained passing (9.3 to 3.4) is just as drastic. It's not just one thing.
My prediction model says it'll be GT 31 - VT 24. I think I'm ok with that. VT's offense is not good, no way about it, but our defense is arguably worse so 24 points seems reasonable. With us at home I think we can get to 31. Although I do think stripping a touchdown off each team's score may be smart, these teams always play close-low scoring games.
(Author's note: Thanks, Matt!).
Statistical Key to the Game
This might be the most confident I've been in years in Virginia Tech's ability to control the line against Georgia Tech while on defense. I don't think the Yellow Jackets will be able to chip away 5 yards at a time, and won't control the line enough to convert in short yardage. As always, there will be times when the Bees frustrate Hokie Nation, but ultimately it won't matter if that doesn't turn into many points.
The stats suggest the Hokies have an opportunity to really gash Georgia Tech on the ground, so failure to do so would be a bad sign. Unlike most years when I'd look to Georgia Tech's yards per carry, this year I care about Virginia Tech's yards per carry...over 5 yards and the Hokies are one Virginia win away from a bowl.
Statistical Prediction
Statistically Virginia Tech is predicted 189 yards passing and 189 yards rushing, while Georgia Tech is predicted 111 yards passing and 258 yards rushing. Subjectively, however, I believe Virginia Tech will play with high emotion and the bye week helps Bud Foster coach his unit on defending the triple option. I'm irrationally confident right now.
Prediction: Virginia Tech 34, Georgia Tech 17
As always a thanks to Football Outsiders, cfbstats.com, and Minitab Statistical Software, and this week to Matt for his insights!

Comments
TL;DR:
Basically, every single blade of grass matters in determining positive gains in Atlanta.
*insert infinite loop gif of nail biting here
Got ya covered.
Obviously the projections cannot account for the Beamer-retirement-fueled aggression that will most definitely be displayed tonight, but the numbers still shock me. We have an awful lot riding on this game and anyone who is aware of our bowl-hunting situation would understand that this game is going to be a hell of a ride. Hoping that we blow them out and send a message to UNC that next week will be their toughest challenge this season.
Unfortunately, this game is most likely a bowl elimination game for both programs. GT has to win out to bowl qualify, we need two games. I don't like the idea of having to beat UNC and LOLUVA to qualify. Therefore it is a must win for both.
Likely, but not guaranteed for either team necessarily. Lots of talk of some 5-7 teams making bowls this year.
Correct, however a guaranteed bowl game is what both teams are aiming for and with UNC on the horizon we have to play our hearts out and secure a win tonight. Mindset is a huge factor and with this being the end of the Beamer era I have reason to believe that we will be fired up. I don't expect this season to fizzle out and regardless we certainly have our work cut out for us (as the case for Georgia Tech).
I won't breakdown specific scenarios until closer to the end, but if bowls need to take 5-7 teams they essentially have to take them in order of their academic progress rate. So as appealing as we might be at 5-7, it would come down to how we rank against the other 5-7 teams in APR.
I was under the impression that we had a very, very good APR. Am I wrong?
You are correct - for football (I'm assuming the rule is based on football and not all sports) the most recent year posted is 2013-2014 and we rank behind the following teams:
Wisconsin
Northwestern
Duke
Michigan
Stanford
Utah State
Nebraska
Clemson
Vanderbilt
Boise State
Air Force
Rutgers
Boston College
Notre Dame
Alabama
Georgia Tech
OK, because I'm procrastinating on writing this paper, I looked this up on the NCAA website. Using the 2013-14 APRs, there are 17 FBS schools ahead of us in football APR (I'm assuming this is based on football APR, since it's a football discussion). There are 4 schools tied with us at an APR of 977. Of the schools ahead of us, there are only 6 that could wind up at 5-7, which are Utah State (currently 5-4), Nebraska (4-6), Vandy (3-6), Rutgers (3-6), BC (3-7), and GiT (3-6). The schools tied with us are UDub (4-5), Louisville (5-4), and Indiana (4-5).
Utah State is playing Air Force, Nevada, and BYU (would have to lose all three)
Nebraska is playing Rutgers and Iowa (would have to split them)
Vandy is playing Kentucky, aTm, and Tennessee (would have to go 2-1)
Rutgers is playing Nebraska, Army, and Maryland (would have to go 2-1)
BC is playing Notre Dame and 'Cuse (would have to win both, yeah right)
GiT is playing us (obvi), Miami, and Georgia (would have to go 2-1)
UDub is playing Arizona State, Oregon State, and WSU (would have to go 1-2, doubt they'd be a bigger draw at a bowl game, though)
Louisville is playing UVA, Pitt, and Kentucky (would have to lose out, no way that's happening)
Indiana is playing Michigan, Maryland, and Purdue (would have to go 1-2, again doubting bigger bowl draw)
So I'd say if it does come down to 5-7 teams we'd be in a good place to get a bowl. Not that that's the way I want to get one, but still...
That is an awesome breakdown. Nebraska and Rutgers are scary as those seems like reasonable scenarios, and so is Georgia Tech (only because of the likelihood that this matters because of a loss to GT, which would mean they need to split Miami and Georgia).
This will be so much easier to figure out in a week if you want to procrastinate again next week and post something on TKP!
#Mathscience. Lets Go Hokies!
No wonder we've lost so many games where we were favored.
How do advance stats take into account for the impact of Brewer/McMillian vs Motley/?? and the loss of GT's best DL and their #2 receiver?
The short answer is that for the most part they don't. They're a good starting point for tendencies, but you still have to factor in special situations (which is why Vegas is slightly better at prediction than computer ratings). In the case of this game I anticipate we will outplay our rush rating, especially given their loss on defense. I don't think our QB changes make a huge impact, or the loss of their #2 receiver.
I disagree on the QB. The complexion of the offense is completely different with Brewer. I wonder what a comparison of the advanced offensive stats with Motley vs Brewer looks like?
Do the advanced stats employ a recency bias or are stats from game 1 given the same weight as game 10?