
Baseball followers who stick to traditional metrics tend to describe sabermetrics as complicated statistics. Stats that don't quantify how good a player is any better than an eye test. The latter part of that sentiment is demonstrably false and not worth spending any portion of this article on. But the first part – that sabermetrics is complicated – underscores the negative perception is more about a lack of understanding than a genuine criticism. Consider the sabermetrics concept that on base percentage is more important than batting average: neither calculation is complicated, but on base percentage better describes a player's contribution than batting average.
Football is a more difficult sport to describe statistically than baseball, but the same challenges exist concerning the perception of "advanced" numbers as opposed to those traditionally used. However, some of those advanced statistics are simply a better indicator for how a player or team is performing than what regularly shows up on ESPN's bottom line or the box score.
These are the "advanced" stats that will define Justin Fuente's first season as head coach of the Hokies, and why they are important.
Points per Play
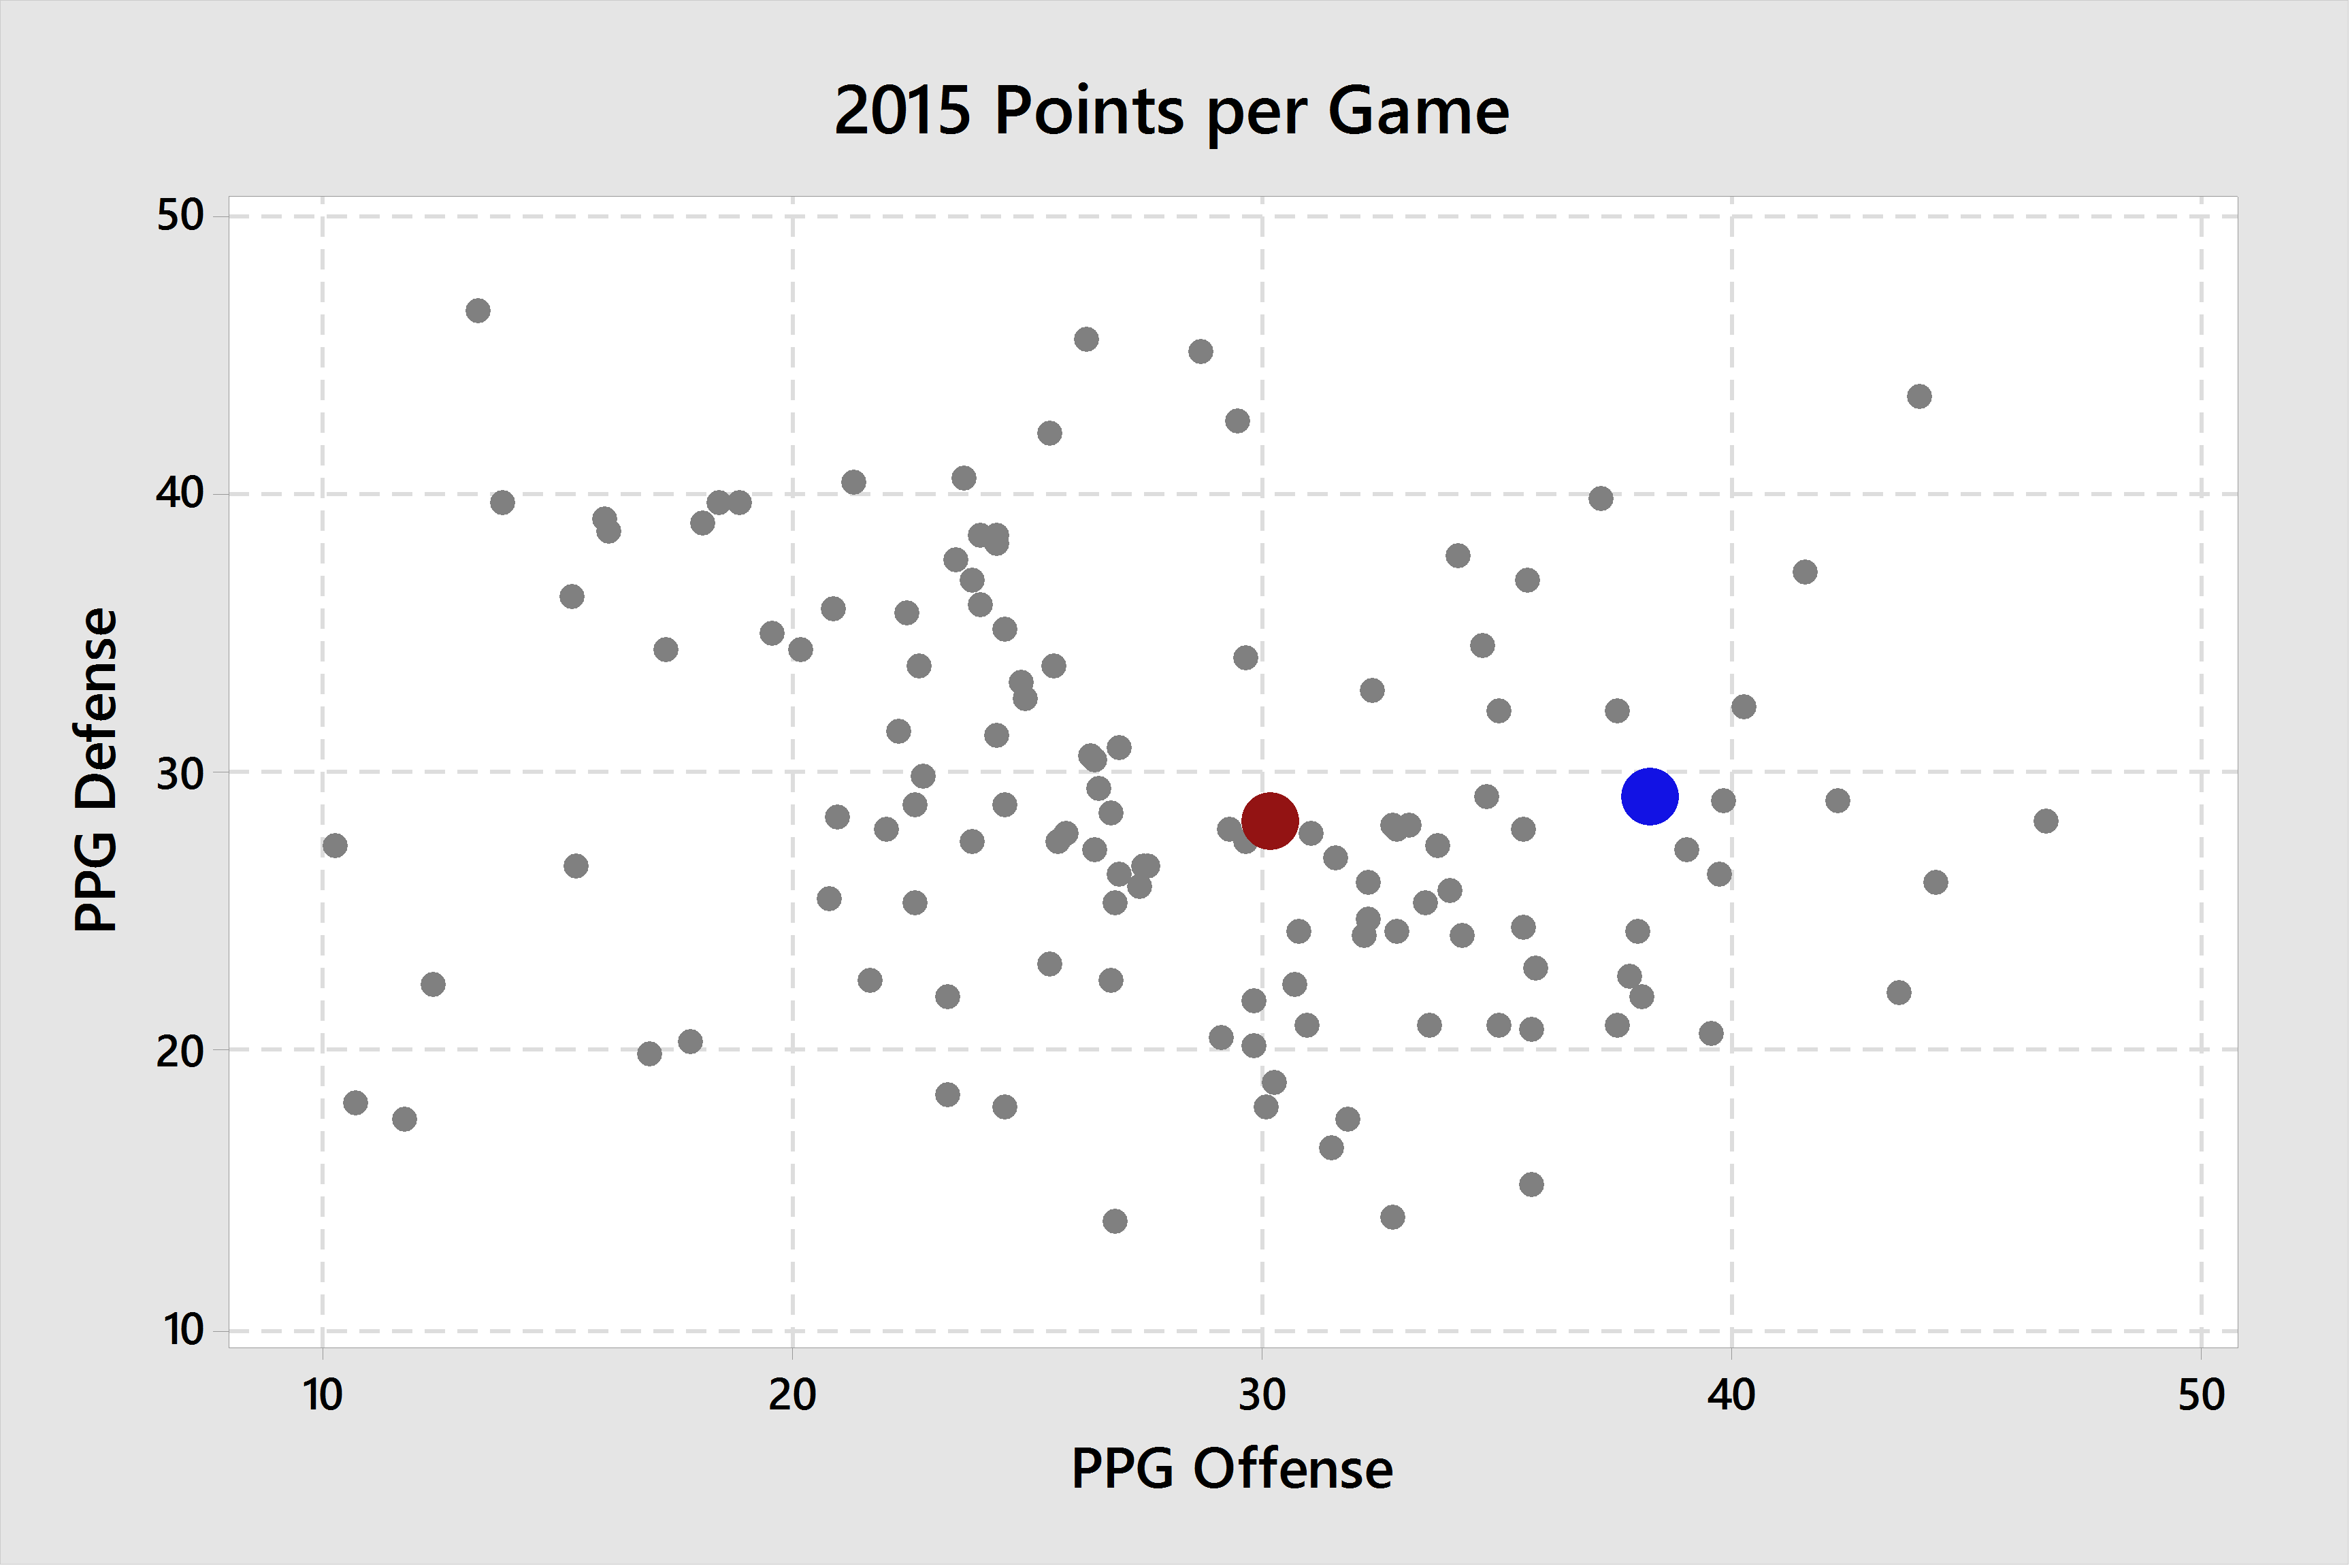
For many years, Hokie fans hung their hats on Bud Foster producing defenses that ranked at or near the top nationally in points allowed per game. But there's a dirty little secret to the statistic: the offense was often run to drain clock and thereby limit possessions and the number of plays opponents would run. If your defense faces fewer opponent possessions, they will give up fewer overall points, but that doesn't make the defense inherently better. Make no mistake, they were great defenses and you don't jump from middle of the pack to elite simply by limiting possessions, but if you want to know how good a defense is a much better way of measuring would be to take out the influence of number of plays and simply calculate how many points they allow per play.
During the competitive portion of the game, Fuente and the Hokies' offense will drive a much faster pace than fans are used to, and less clock will be used. As a result, it is all but certain that the defense will face more plays than usual and give up, as a whole, more points per game.
In 2015, here are the points per game scored and allowed by every team in FBS, with Virginia Tech and Memphis highlighted:
Now here are points per play for 2015:
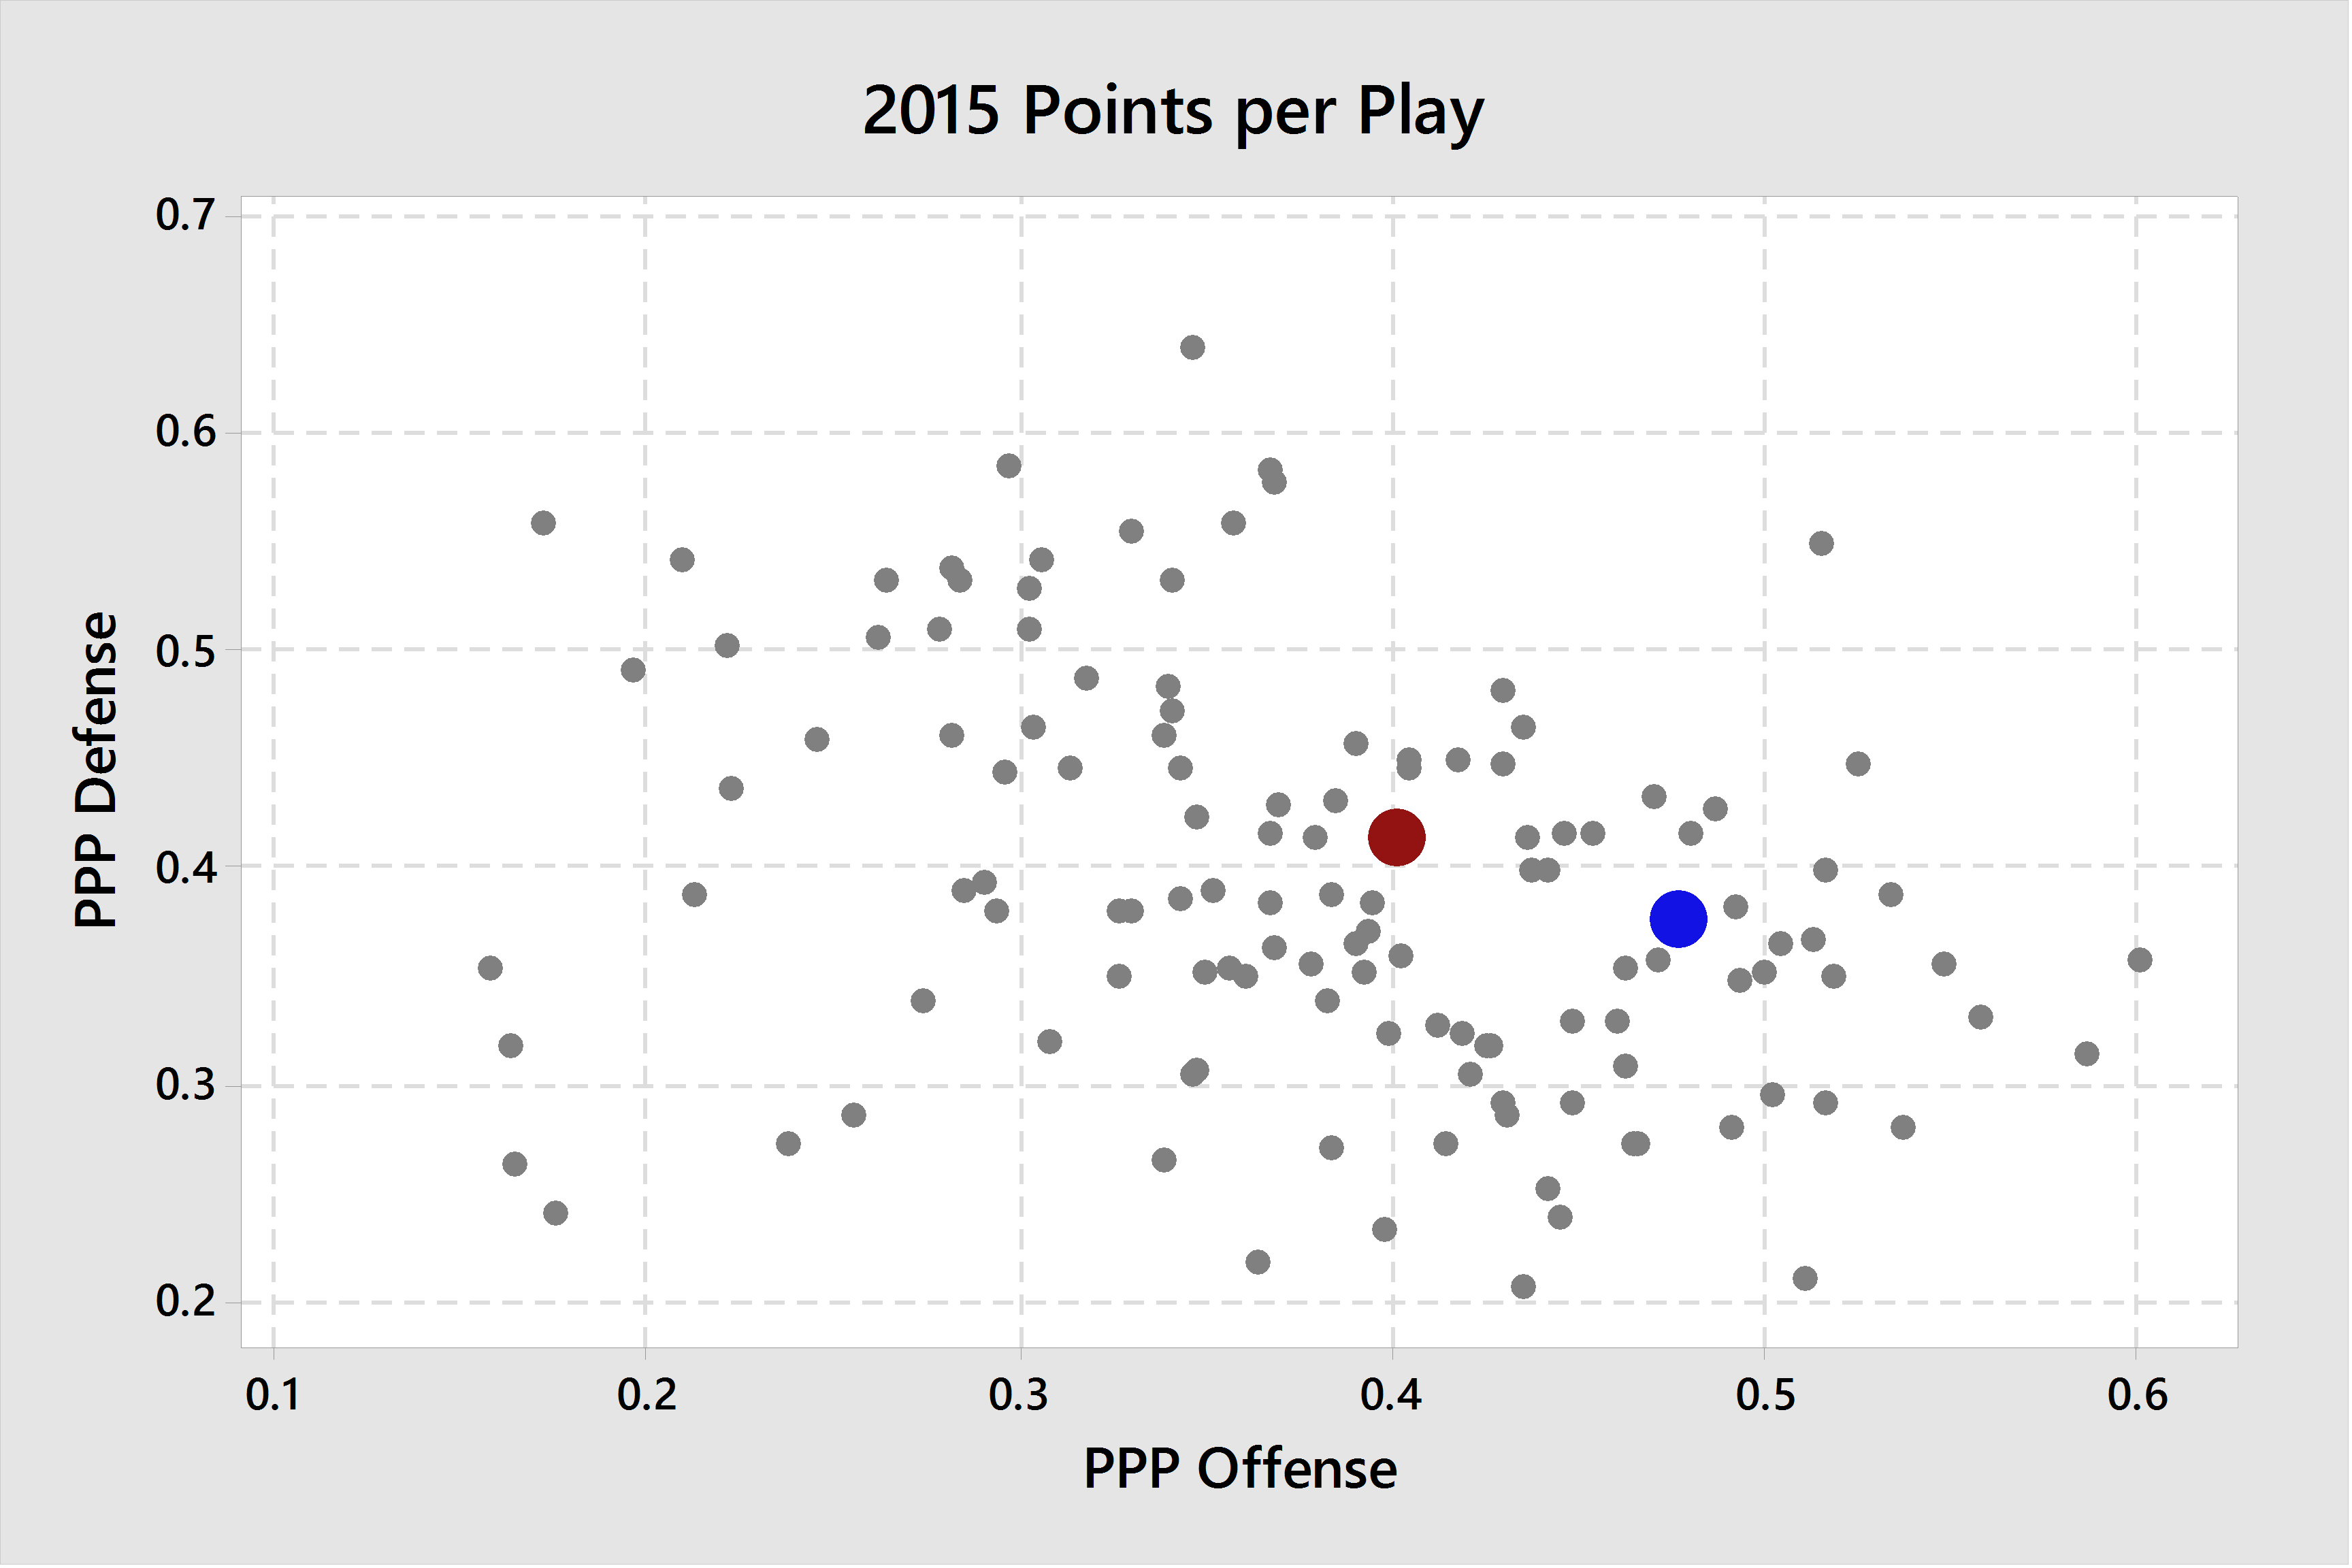
For the Hokies, the team rates about the same in each. But examine what happens to the Memphis defense as the metric changes from points allowed per game to points allowed per play. The Tigers moves from well below average (80th nationally) to just above average (60th nationally). Because the Memphis offense gave their opponents more possessions they gave up more overall points, but points per play show the defense was more effective than that statistic would suggest.
For long-time fans used to 20-13 games, seeing scores like 34-23 may feel like the defense has slipped at the expense of an improved offense. But points per play cuts right through that myth.
Pace
Pace is simply how quickly the offense is able to run plays. It predominantly comes down to how quickly the offense can line up and snap the ball after a down. The offense controls pace and the defense must be react to it. Coaches who have adopted fast pace believe it's advantageous for a few reasons. The defense has no time to shift after lining up and must show their cards immediately. This can catch a defense out of position or force a mental mistake. Also, in theory the opposing defense will get tired before the well-conditioned offense does. There is almost certainly some degree of merit to each of these.
In addition to tactical advantage, there is another good reason for the better team to play with pace: sample size. Simply put, larger samples will trend towards the mean. So if the expected points per drive are in the offense's favor, it's in its best interest to increase the sample size by increasing the number of drives as much as possible. Conversely, this is why a key component of underdog strategy in football is to play at a slow pace and limit the number of drives.
This can play out in very meaningful ways — consider that given the same per-drive points, two games played at different paces might end up with scores of 20-14 or 30-21 going into the final drive. In the first case, it's a one-possession game. The second scenario requires that play, plus a recovery, plus another low-probability play. And the only difference was pace.
Time of Possession
Repeat after me: I will not value time of possession. I will not value time of possession. I will not value time of possession.
Even before Fuente's arrival at Virginia Tech, time of possession was an irrelevant stat that should have never been used as a measure of who played better or "controlled the game". Teams with solid leads intentionally run out the clock, and teams that are behind intentionally try to save clock. So time of possession is a result of how a team is playing, and not the cause of it.
Since teams obviously start manipulating clock later in games based on the score, consider just the first half of games. If time of possession is a meaningful indicator of the offense controlling the game and performing better, then better offenses should show a higher percentage of the possession in the first half. Here are the top five and bottom five teams in first half time of possession in 2015 according to TeamRankings.com with their S&P+ offense ranking in parentheses:
1. Stanford (5)
2. Rice (102)
3. Arkansas (1)
4. Western Michigan (24)
5. Southern Methodist (79)
124. Mississippi (9)
125. Hawaii (119)
126. UCLA (23)
127. Arizona (31)
128. North Carolina (17)
The extreme ends of the stat contain some of the best and some of the worst offenses in the country. Because time of possession is not a good indicator.
With an anticipated increase in pace, the statistic becomes even more meaningless. For simplicity, imagine a fantasy scenario where on every drive, Virginia Tech runs 10 plays and takes two minutes off the clock and scores a touchdown. Their opponents run only 5 plays on each drive but at a slower pace and also use two minutes on the clock and then punts. At the end of the game, time of possession is tied 30:00-30:00 but Virginia Tech has won 105-0. Hokie fans laugh and high five their way out of the stadium to go home and enjoy some Thanksgiving leftovers.
That's obviously a simplistic scenario but makes the point...the speed in which you run plays has a drastic impact on time of possession, but is used as an advantage. Time of possession would suggest it was a disadvantage. So please repeat one more time: I will not value time of possession.
Comments
Great perspective. I have, in the past, tried to reconcile TOP with the "eye test" to no avail. The idea of looking at pace and points per play is a much better idea. Nice breakdown.
105-0
Thanksgiving Leftovers
Coffee Snort
THANK YOU - I'm going to have a great day!
There's always a turkey leg for Clara
Points per play should be simple. The GS Warriors were a GREAT defensive team when you use PPP, but many of the older NBA analysts couldn't/wouldn't wrap their head around that concept.
Back to class. Nice. Maybe we could see this stat each week to further drill it into our heads.
Great work. Maybe if I read it a few more times I will understand it all. (I'm bad at the maths)
Excited to see the offense go to work. Seems like it'll be a whole new
identity for the team. What would be especially cool is if the defense isn't
constantly on the field, our DB's are doing good in coverage and it's all kinda balanced.
Sure, that might be the sane, logical, rational way to interpret all this... Me, I was more like: 'So what you're saying is that the good guys are going to win every game 105-0. Sweet.'
Heh, that would be sweet.
In a few days we won't have to imagine it.
And tomorrow night Hawaii and Cal play in Australia at 10:00 EST. It's not Hokie football but it's live 2016 regular season college football and it's about damn time
At least this summer had the Copa/Euro plus the Olympics to hold me over.
Next summer will be brutal.
Next year we'll be watching Buzz & Co into early April so that'll shorten the offseason by a month or so
For those who are so inclined, there will be the FIFA Confederations Cup and the World Cup qualifying during next summer as well.
Tomorrow I'll watch a college football game for which I do not know the outcome. This is exciting, but also means I have to get used to commercials again... YouTube has spoiled me.
Commercials are for refills
I agree on TOP. The Hokies resoundingly won the TOP in plenty of games over the last three years where that was all that they won.
Final scores? The ultimate stats!
well...this kind of undermines the little project I was working on. No matter. This turned out better than anything I would have come up with. Great stats!
I had already determined TOP was a garbage stat. I'm looking at punts/drive and 3-and-outs/drive as well. VT basically averaged about
12 possessions per game. I think Memphis' average (which I haven't finalized) is closer to 13 or 14 possessions/game. The astounding figure is that VT went 3-and-out something close to21%of their possessions. Memphis is closer to9%I think. VT's average 3-and-out drive was around 1 min and 30 seconds. So TOP is worthless and people who are worried about our defense getting tired from the fast paced offense not giving our defense enough of a break shouldn't be worried.EDIT:
Memphis Drives/Game - 13.25
VT Drives/Game - 13
Memphis 3-and-out% - 14%
VT 3-and-out% - 23%
Memphis 3-and-out avg drive time - 0:53
VT 3-and-out avg drive time - 1:31
Memphis Punt % - 32%
VT Punt % - 41%
Memphis PPP - 0.49
VT PPP - 0.35
Memphis PPD - 3.01
VT PPD - 1.92
If it helps I ran the drive by drive stats for Memphis and Tech last year: http://www.thekeyplay.com/content/2016/april/25/just-how-fast-justin-fue...
Not to throw gas on the fire, but Football Outsiders already provides First Down % which is just the inverse of 3-and-out %! Look for it in stat previews this seasons.
And if you have more stat knowledge to throw out there, I'm sure the community wants to read...
Let's see, punts per drive. You either punt, or you don't...50%! This is fun.
I actually think points per possession is the most important statistic, as it factors out pace of play. For example GT may average 4 yards per carry, burn a huge amount of time, and have a lousy points per play average. Clemson may average 10 yards a play with almost no time off the clock and have a three times the points per play. If GT scores on more of their drives GT wins, despite losing the points per play, because they won the points per possession.
Have to agree, especially as the presentation here emphasizes points per play as a defensive stat. Points per possession works much better to distinguish between "bend but don't break" and "bend before eventually breaking", for example, and it better reflects a defense's ability to determine the number of plays the opposing offense gets to run, regardless of how many possessions our faster paced offense gives the opposing offense.
you have no idea how happy it made me to see a by the advanced numbers article posted. One of my favorite series on TKP.
How I interpret this information:
More possessions for the opponent = More Chances for pick 6's!
More points per game = Less opponents running the ball to wind the clock down = More Chances for pick 6's!
More pick 6's = Less Punts = Fewer Tim Settle Punt Return Touchdowns :(
So I follow the points per play statistic and relevance of pace compared to total game stats. But the games are restricted to a total of 60 minute sample sizes.
So wouldn't offensive plays per game (less punts) or plays allowed per game by the other team be relevant statistics to track? And what are the target number of offensive plays that Fuente should be running (and number of plays Foster wants to keep the opponents to). I assume you subtract punts from this number since they are not offensive plays (unless there is a fluke). Not sure what to do with punts from the defensive perspective.
This is interesting to me but trying to wrap my ahead around all of the factors that should be prioritized.
Thanks
in that 60 minute sample size, it's only the points that matter in the end. Look at how many plays we had in a game against wake forest in 2014. Or against Miami that year. Any game where you have turnovers, stalled drives, missed field goals, etc would skew that statistic to make a team look better or worse than they really played. Any meaningful statistic has to incorporate points.
Someone brought up a GT style of play vs a Clemson style of play and a reason to prioritize points per drive instead of points per play and I can see that, because all the arguments for PPP also applies to PPD. Just number of plays per game could be high no matter the result. Imagine a scenario like
JoeJoel brought up only instead of one team scoring on 10 plays every 2 minutes, both teams went 5 plays and turned over every 2 minutes. Each team would have 75 plays in the game, but no points. Would one offense be considered better because they got off 75 plays? Would one defense be considered worse because they allowed 75 plays, but no points?Thanks for clarification. I understand that points have to be part of the equation. But looking at it like a math problem - if we know points per play and points per play allowed, then don't we then just need to understand how many plays are ideal in 1 game set to be successful (vs. time of possession)?
Even if a team is averaging a high PPP, they could be throwing touchdowns or interceptions on every first down - limiting the number of plays / length of drives in a given game. I would think you would track both to get a balanced look at both explosiveness / points for a game and control of a game (without getting caught up in time).
Not discounting anything said - just trying to better understand.
the ticket is points/possession
I agree. This more often correlates directly with the final score. Except for points directly off turnovers (pick six, etc) where I don't think the defense is ever awarded a possession and those are relatively rare (even though we expect them every drive). Also with something like a safety or an on sides kick.
But honestly, on sides kicks never happen these days.

*Joel
Outcome and process aren't the same thing. Yards correlate strongly to points. If you're able to move the ball on average you'll put up points, though you may have a game where things go haywire in the red zone. The best way to overcome red zone problems is to get into the red zone over and over.
Clemson 2015-16: .462 points/play (27th)
Clemson 2014-15: .356 points/play (79th)
GT 2014-15: 9th in points/play
When GT is good they rate highly at points/play because their offense puts up numbers and grinds opposing defenses to dust. Last year GT was a dumpster fire. The problem with points/drive is that it relies on your defense to get you the football. Points/play more or less takes your defense out of the equation and isolates the offense as much as the offense can be isolated.
It depends on what those teams did with all those plays. Which is why yards is important.
can you explain this more?
My thinking was after an opponents drive, you almost always get the ball back either by a defensive stop or they score (almost because of the occasional on sides kick). In your average game, both teams have the same number of drives (+/- 1, depending on how the clock falls). If you opponents average fewer points per drive, you are probably going to win. Points per play can have a lot of variation with the same result. Team A gets to the line quickly, looks to the sideline and calls a new play, taking the entire play clock, but they are efficient. They score in 10 plays taking ~6 minutes of game time to do so. Team B runs a true hurry up and has a sustained drive getting just enough yardage per play. They take ~6 minutes of game time to score, but run twice as many plays. That scenario results in a tied score, but your points/play is vastly different. However, your points per drive is the same. I guess my original point was that plays per game doesn't have to correlate with who wins. I think points/play is better, but I can think of too many theoretical situations where it is not reflective of which team will win the game. If you're going to pick a stat that will most likely jive with winning games, points per drive comparison between you and your opponent seems like a good pick.
Generally the more plays a team runs, the more likely it is that the results will be closer to the true talent level. It's a matter of sample size and variance- the best way to overcome variance is to run lots of plays so that water eventually finds its level. If you only get 6 drives and 4 of them are punts it probably won't matter if you score TDs on the other two drives. If you get 12 drives and 8 are punts but you score TDs you'll end up with 28 points and you may yet win. Plus field position is a thing that matters, and it's likely to matter more in a game with fewer possessions. The more drives you get, the larger the margin for error. That's where the defense comes into play.
Just looking at last year:
https://www.teamrankings.com/college-football/stat/plays-per-game
I don't necessarily think more plays=victory. There are multiple ways to win. Some teams bleed clock, while other teams bury their opponents with volume. IIRC the Oregon offense under Chip Kelly would see a huge spike in their offensive efficiency after they ran 50 plays or so- once they got you on the field for that long, they'd worn you down and figured you out.
If your defense creates a lot of 3 and out's the offense will get more plays. Does that mean they are better offense than one with a defense that cannot get off the field? If special teams constantly gets you great field positions you may not need many plays to score. Does that mean the offense is not as good? The offense does not have that much control over how often or where they get ball. A hurry up offense may get the ball a couple more times by allowing more possessions per game, but the defense, the other offensive style, and special teams probably have a larger effect. Having more plays likely does mean you are not going three out, and may wear down other teams, and other factors leading to scoring, but a more explosive offense might consistently need fewer plays to score. The job of the offense is to score when they get the ball, where ever on the field they get it. How can you have a better measure for an offense than how well they do that? Using any other metric brings in a lot of variables outside of the control of the offense, though can idea on what types of offense may be better at scoring.
That's why a lot of metrics rate explosive plays highly. Turns out it's really hard to get 4 yards a play every play.
I think you're kind of splitting hairs a little comparing PPP to PPD. It's just another level of detail, really. PPG is really rough, PPD is more accurate, PPP is most accurate.
But I think PPD is easiest to normalize. If you're trying to predict how two teams will do against each other and there is no history between them PPD will give you the best idea, IMO, of what to expect because almost every game will have about the same number of drives for each team. Different games won't necessarily have the same number of plays. For instance, VT might average 60 plays per game where Memphis might average 80 plays per game. But if the two teams played each other you wouldn't know how many plays each team would have but you could guess that they would each get about 12-14 possessions. If you know roughly what a team scores per possession you don't need to know how many plays they might run to predict scores.
in 2015 VT had a PPP of 0.35 and a PPD of 1.92
in 2015 Mem had a PPP of 0.49 and a PPD of 3.01
Assuming 13 possessions for each team I would predict a final score of Mem - 40, VT - 25
I wouldn't be able to come up with that projection based on PPP...but PPP would tell me that I could expect Memphis to win...I just don't know by what margin
Great article. Thanks!
You Engineers love this stuff!! My head is spinning. Good read though.
I. WILL. NOT. VALUE. TIME. OF. POSSESSION. Phew. That wasn't so hard.
I really hope we win the time of possession battle this year. did I do that right?
VT was 30th in the country at TOP last year. Good to know there was at least one stat where the Loefflerfense was in the top 40. In true Loeffler fashion that one stat was possibly the most meaningless stat of all.
well when we start each possession with a false start and the clock keeps ticking hello TOP!
Yes, time of possession is an important metric and is the cause of victories.
What do you think of some of the other advanced metrics that get used like S&P+ and FPI?
I've loved Bill Connelly's preview series this offseason based around S&P+ and it seems like it judges teams more accurately than anything else I've seen, and it seems to be based on sound principles (everything judged on a play-by-play basis, which seems closer to what you're discussing here) but I don't know the nuts and bolts of how it works.
ESPN bandies about FPI quite a bit, and it's conclusions typically seem a little ridiculous but I know nothing about how it works.
I have no idea what either of them stand for, but instead of looking it up, I have been spending way too long trying to guess. I believe our offensive Sack and Punt numbers were too high, but not as high as our Formation Proliferation Ideology, which had to be one the highest in the country. I expect we will be able to improve both this year.
I will value having more points at the than my opponent end of the game... I will value having more points at the than my opponent end of the game... I will value having more points at the than my opponent end of the game...
ctrl + c, ctrl + v fail
No wonder I need glasses. Crap.
I wonder if number of plays per drive is correlated with points and/or victories.
So talking PPD metrics:
A pretty sloppy Tech offense under Fuente puts up a 2.4 (2.25 if you count the last clock kill drive)
Loefflers BC put up a 1.4 PPD which was pretty much where we were with the past several years.
Ill take that extra point per drive if thats the worst our season looks.
Stats that are going to define our season. 5 fumbles...
Evan's pitch was unacceptable. I'm going to assume that will be cleaned up. Just don't put the ball on ground.
Stats that are going to define our season. Completions, Rushing Yardage, Interceptions, Wins. Theirs and ours.