
Let's pretend it's 2013 and you are a recruit in Virginia who wants to play college football in the Commonwealth. You visit Virginia, and the Head Ball Cop tells you about what they are building, and how great the academics (allegedly) are. You visit Virginia Tech and Frank Beamer pitches the Hokies' long history of success, the experience of playing in front of actual fans in Lane Stadium, and how engineers make more money than wine tasters. Advantage Hokies, although a reasonable person can see how someone might mistakenly choose to be a Hoo.
Now imagine the same right now. Both programs are going to sell you about what they are building with new coaches and discuss the same academic components as always. But one team's season just ended after getting embarrassed by the other 52-10, while the other is about to play in the ACC Championship Game and will enter 2017 in a really good position to return. The case for Virginia Tech over Virginia is the strongest it has been in years.
Virginia Tech's matchup with Clemson is another great opportunity for the Hokies. Tech had two opportunities this season to provide they could compete with an elite team. Against Tennessee the Hokies fumbled away a game in which they led in total yards and yards per play, and dominated North Carolina — albeit in a hurricane which according to Tar Heels should be disregarded. Against Clemson, Justin Fuente will have the chance to demonstrate which game is more representative of his ability to coach in big games.
But according to W-L-W-W neither Fuente, Dabo Swinney, or any players on the field will have anything to do with the result.
Where the Season Stands
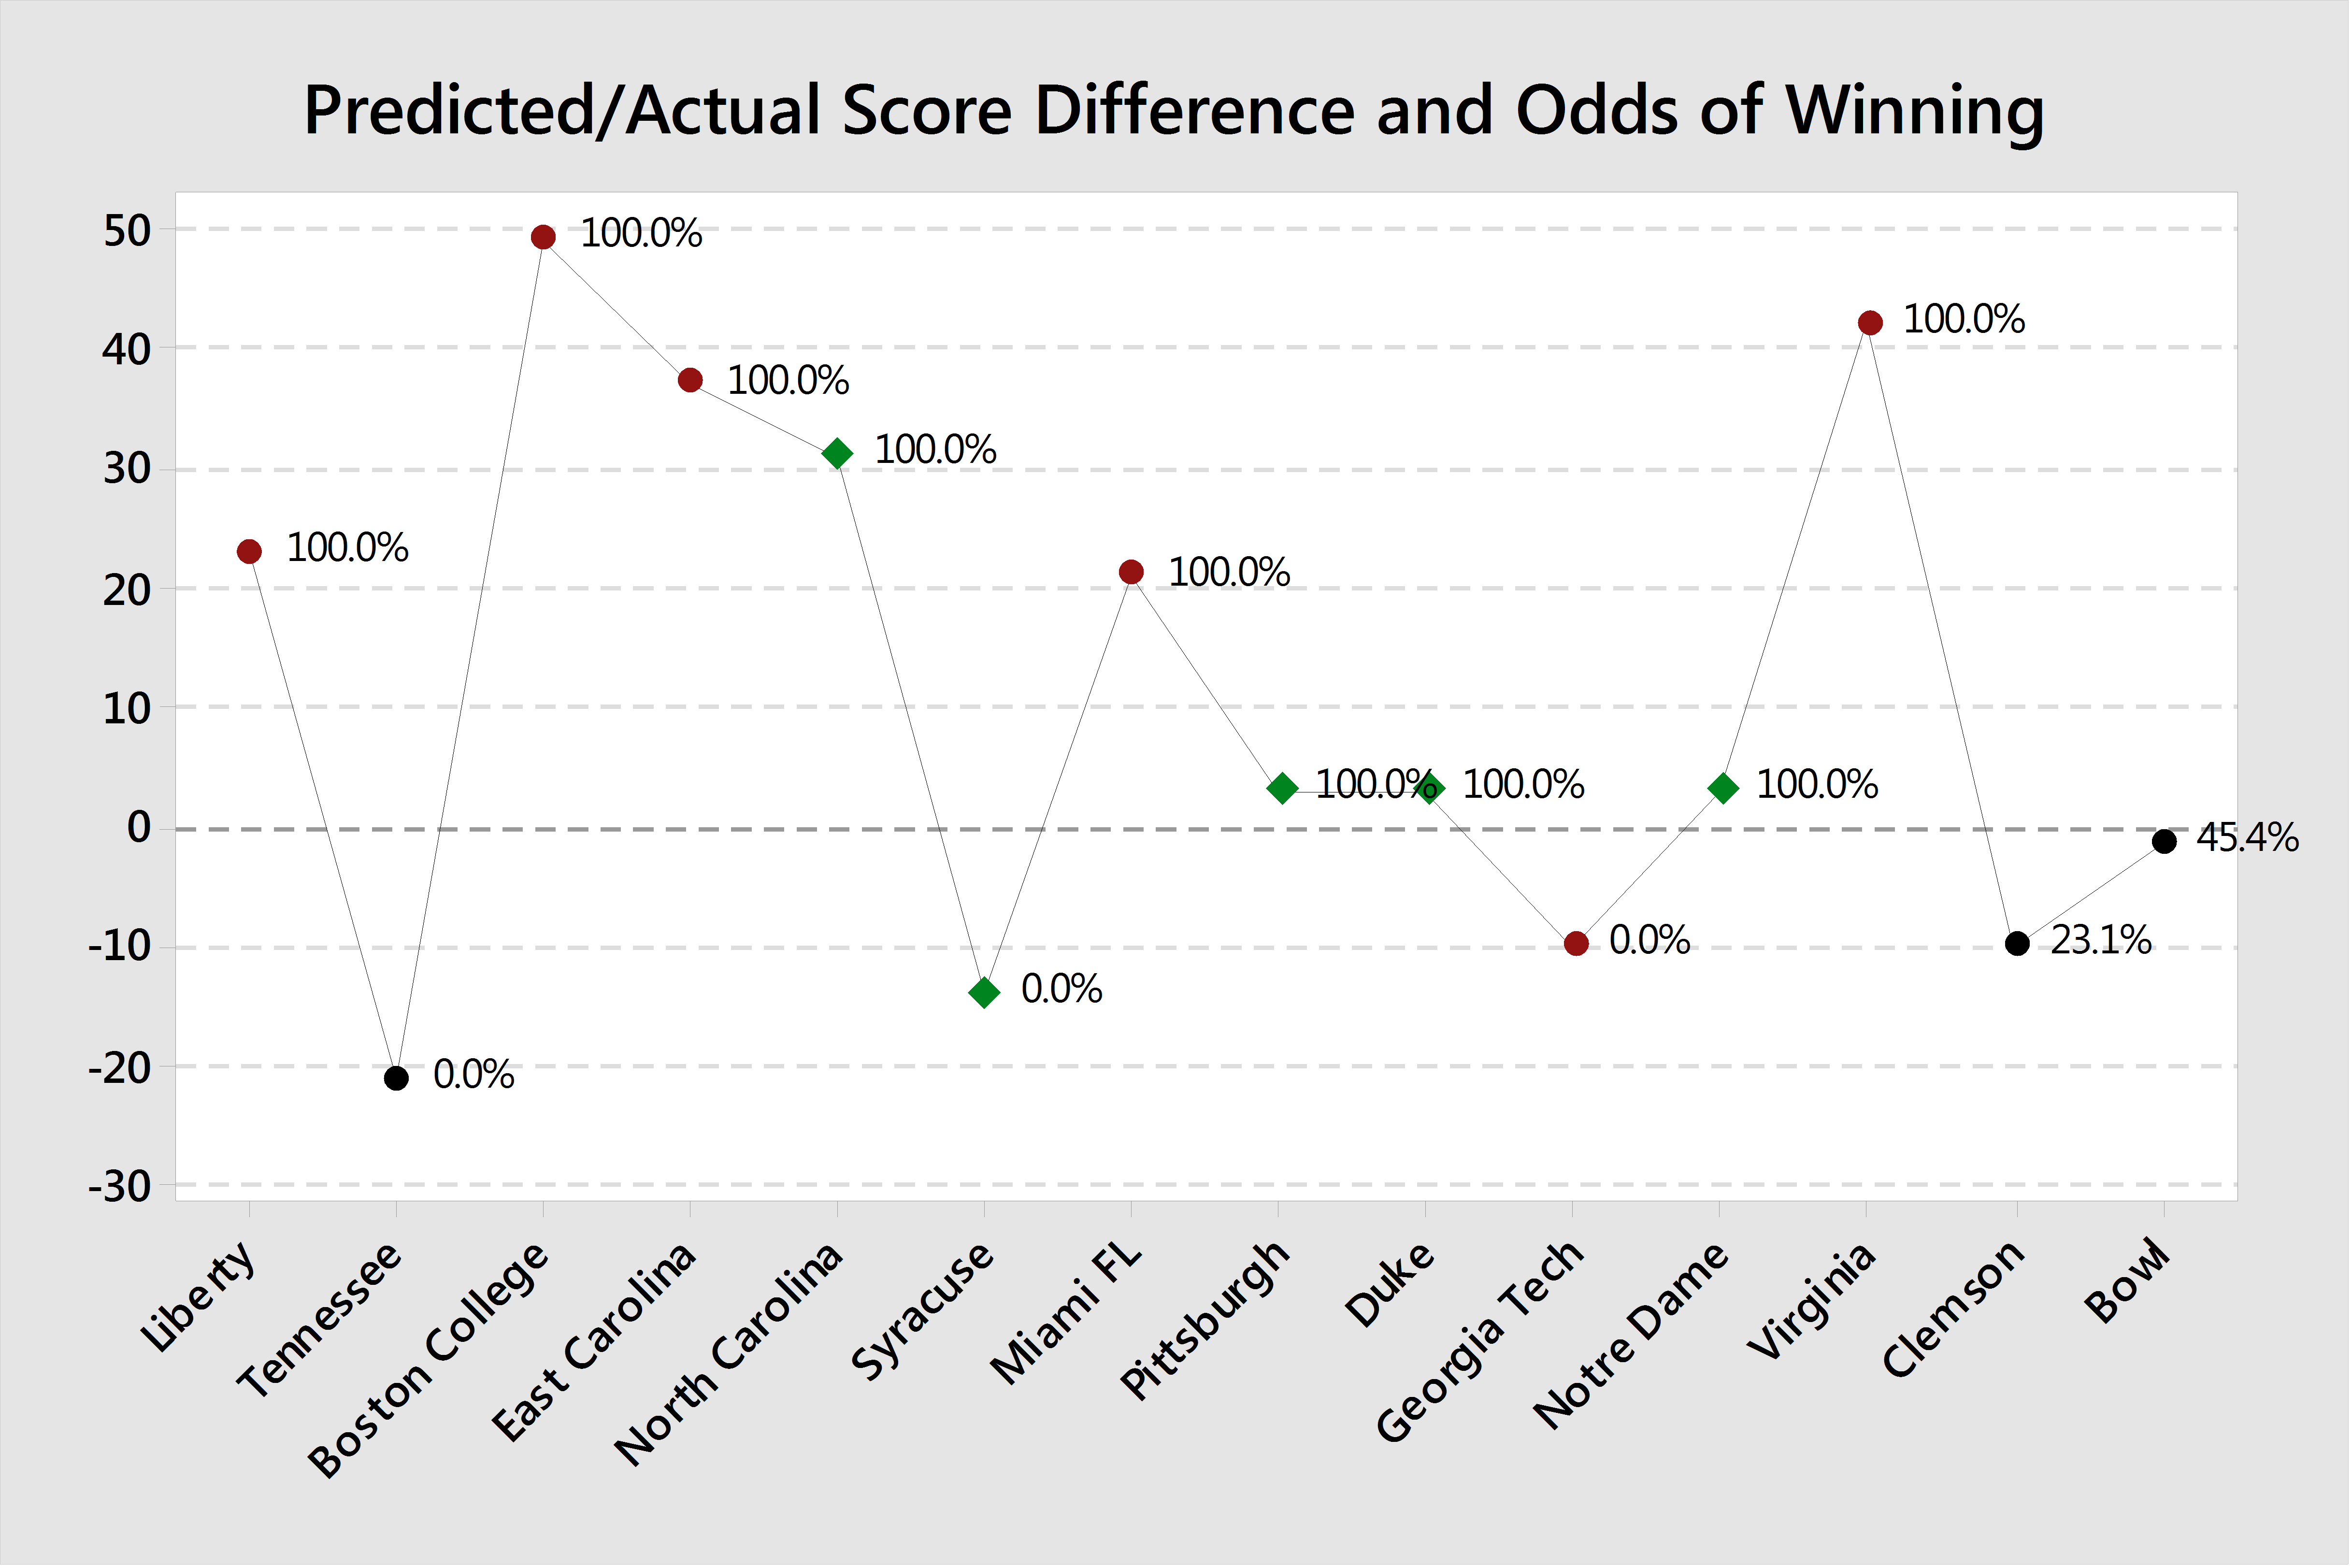
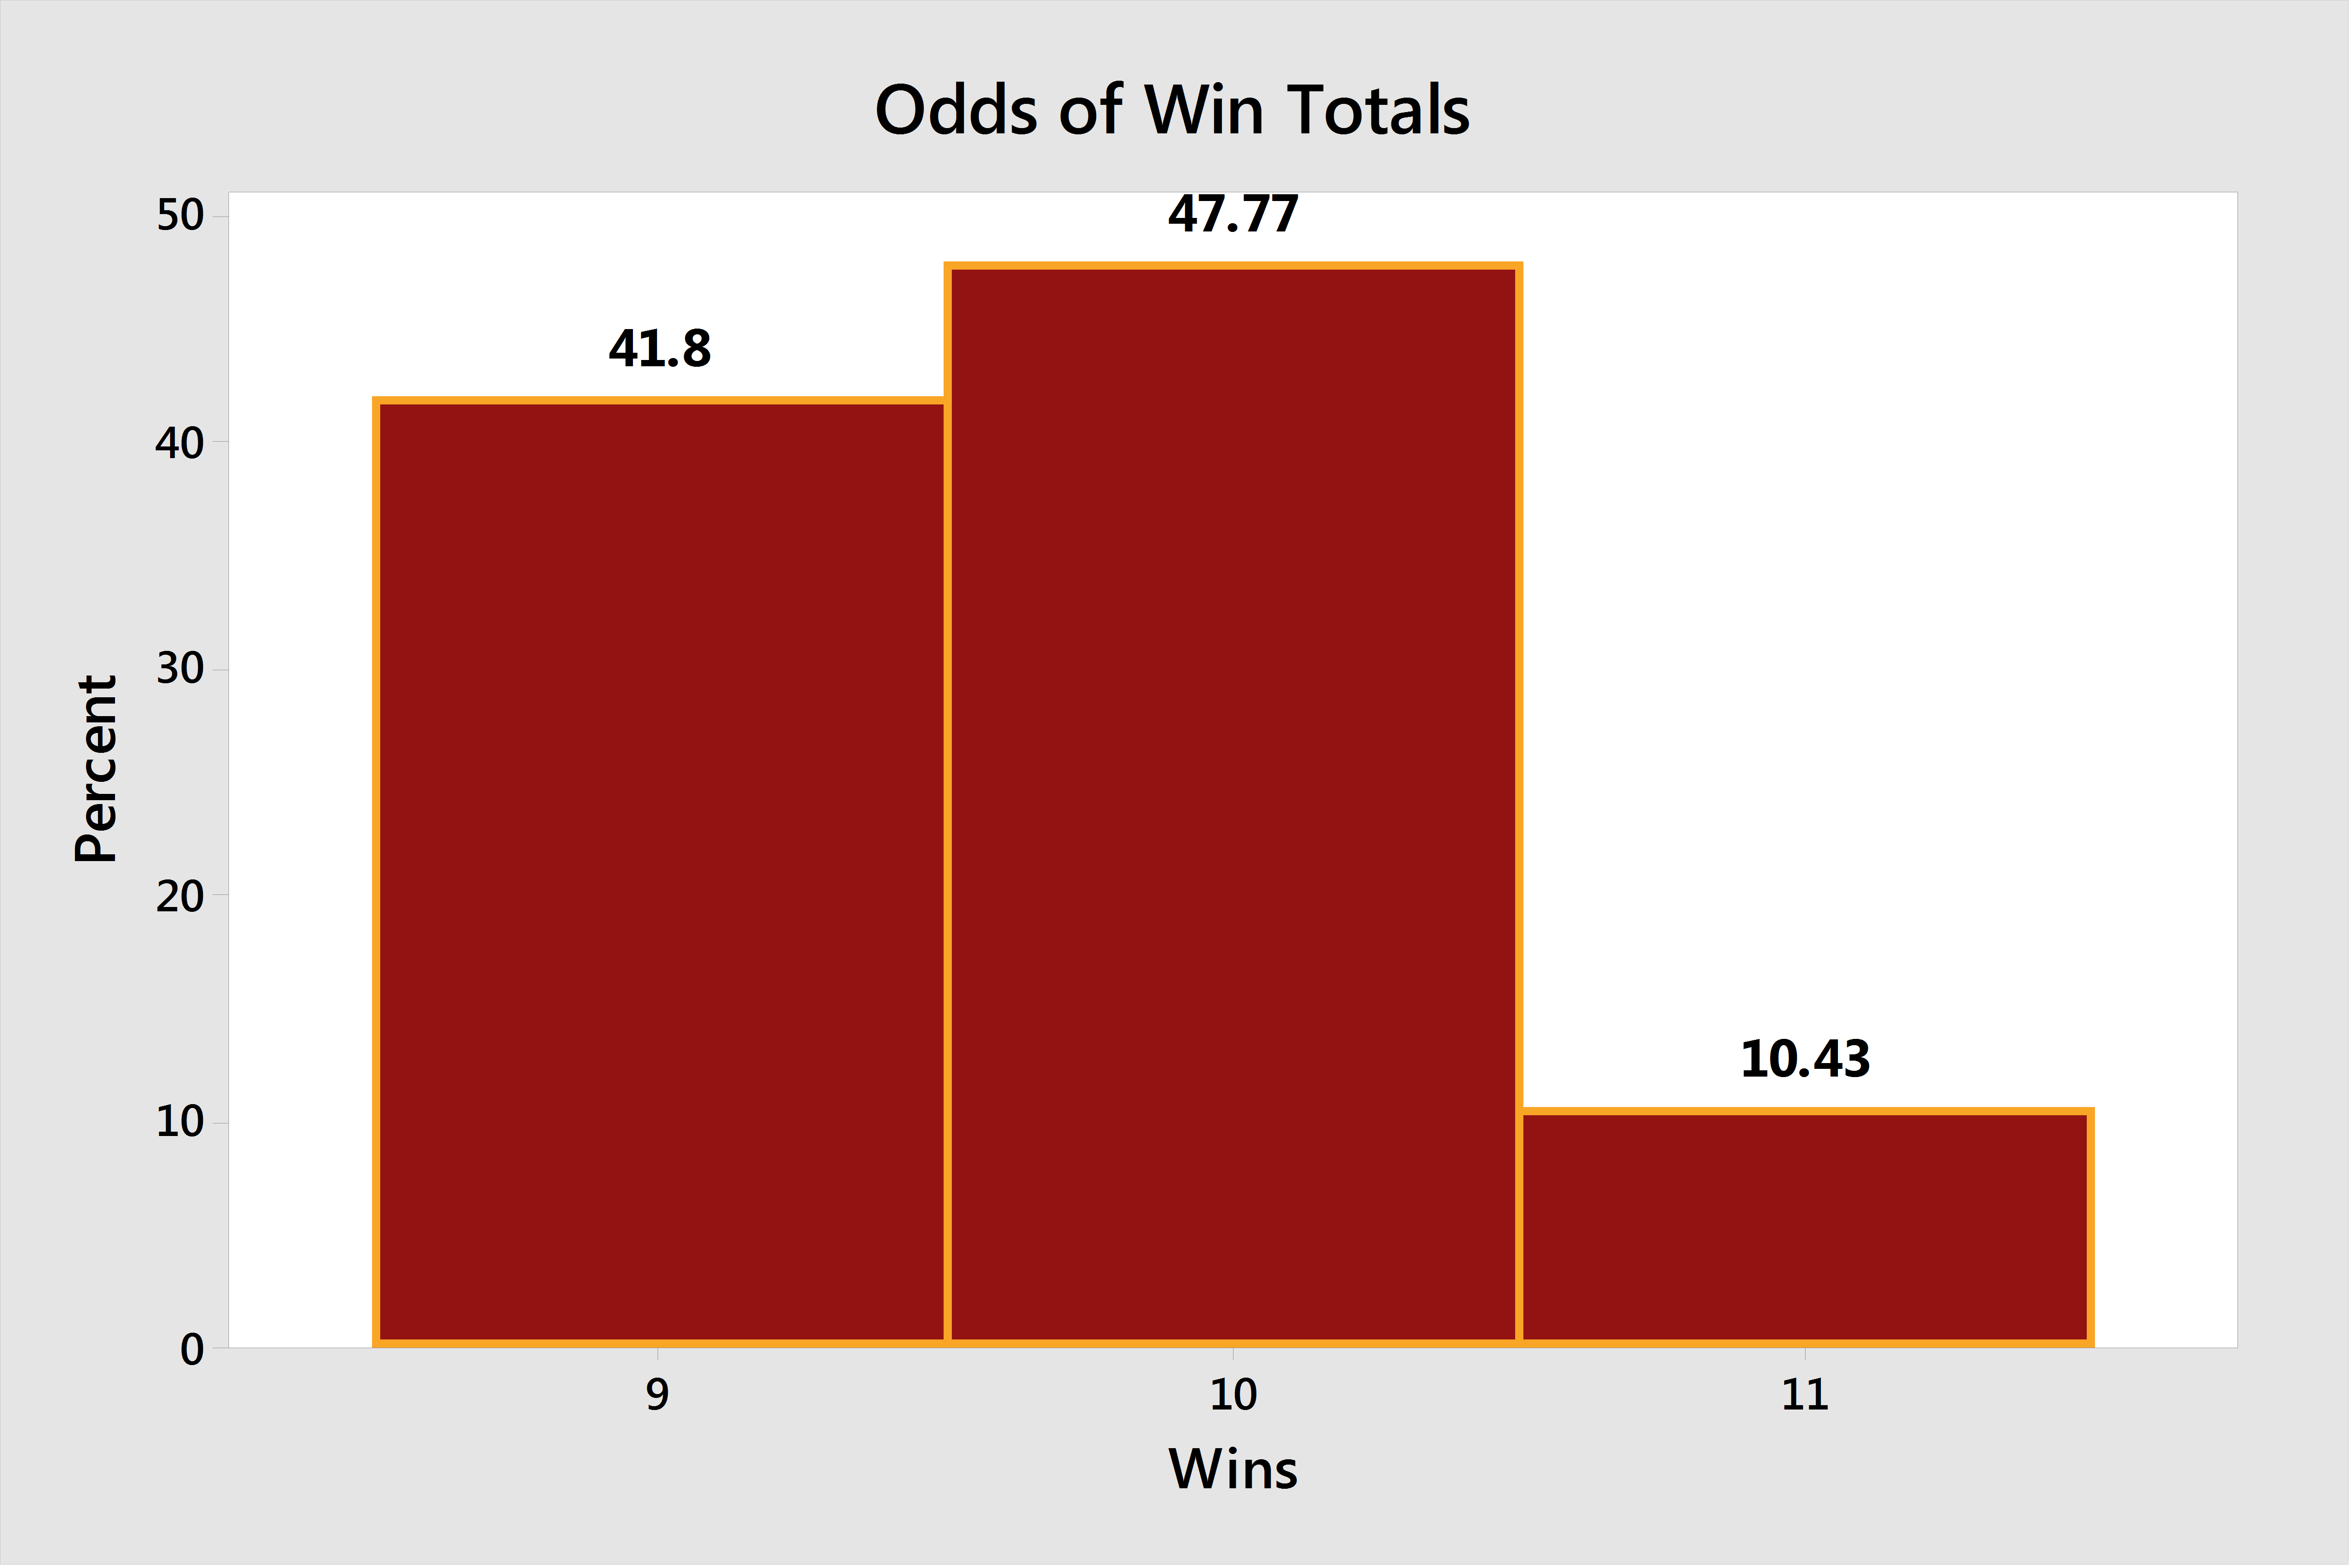
Virginia Tech is currently 9-3 and in the ACC Championship Game, just like we everyone predicted. Determining the end-of-season odds and win totals is difficult because the final opponent is not yet determined. To take a guess at it, I assumed that if Virginia Tech beats Clemson the bowl will be against a favored team and gave that team a 70% chance of winning. I also assumed that if Virginia Tech loses to Clemson, the bowl opponent is a tossup with a 50% chance of winning. Combining the odds of beating Clemson with these assumptions, an expected scored difference and odds of winning can be estimated for the bowl game.The actual and predicted score difference and odds of winning each game are:
The odds of each possible season win total are now:
Rankings and Computer Predictions
The computer rankings and predictions for each team:
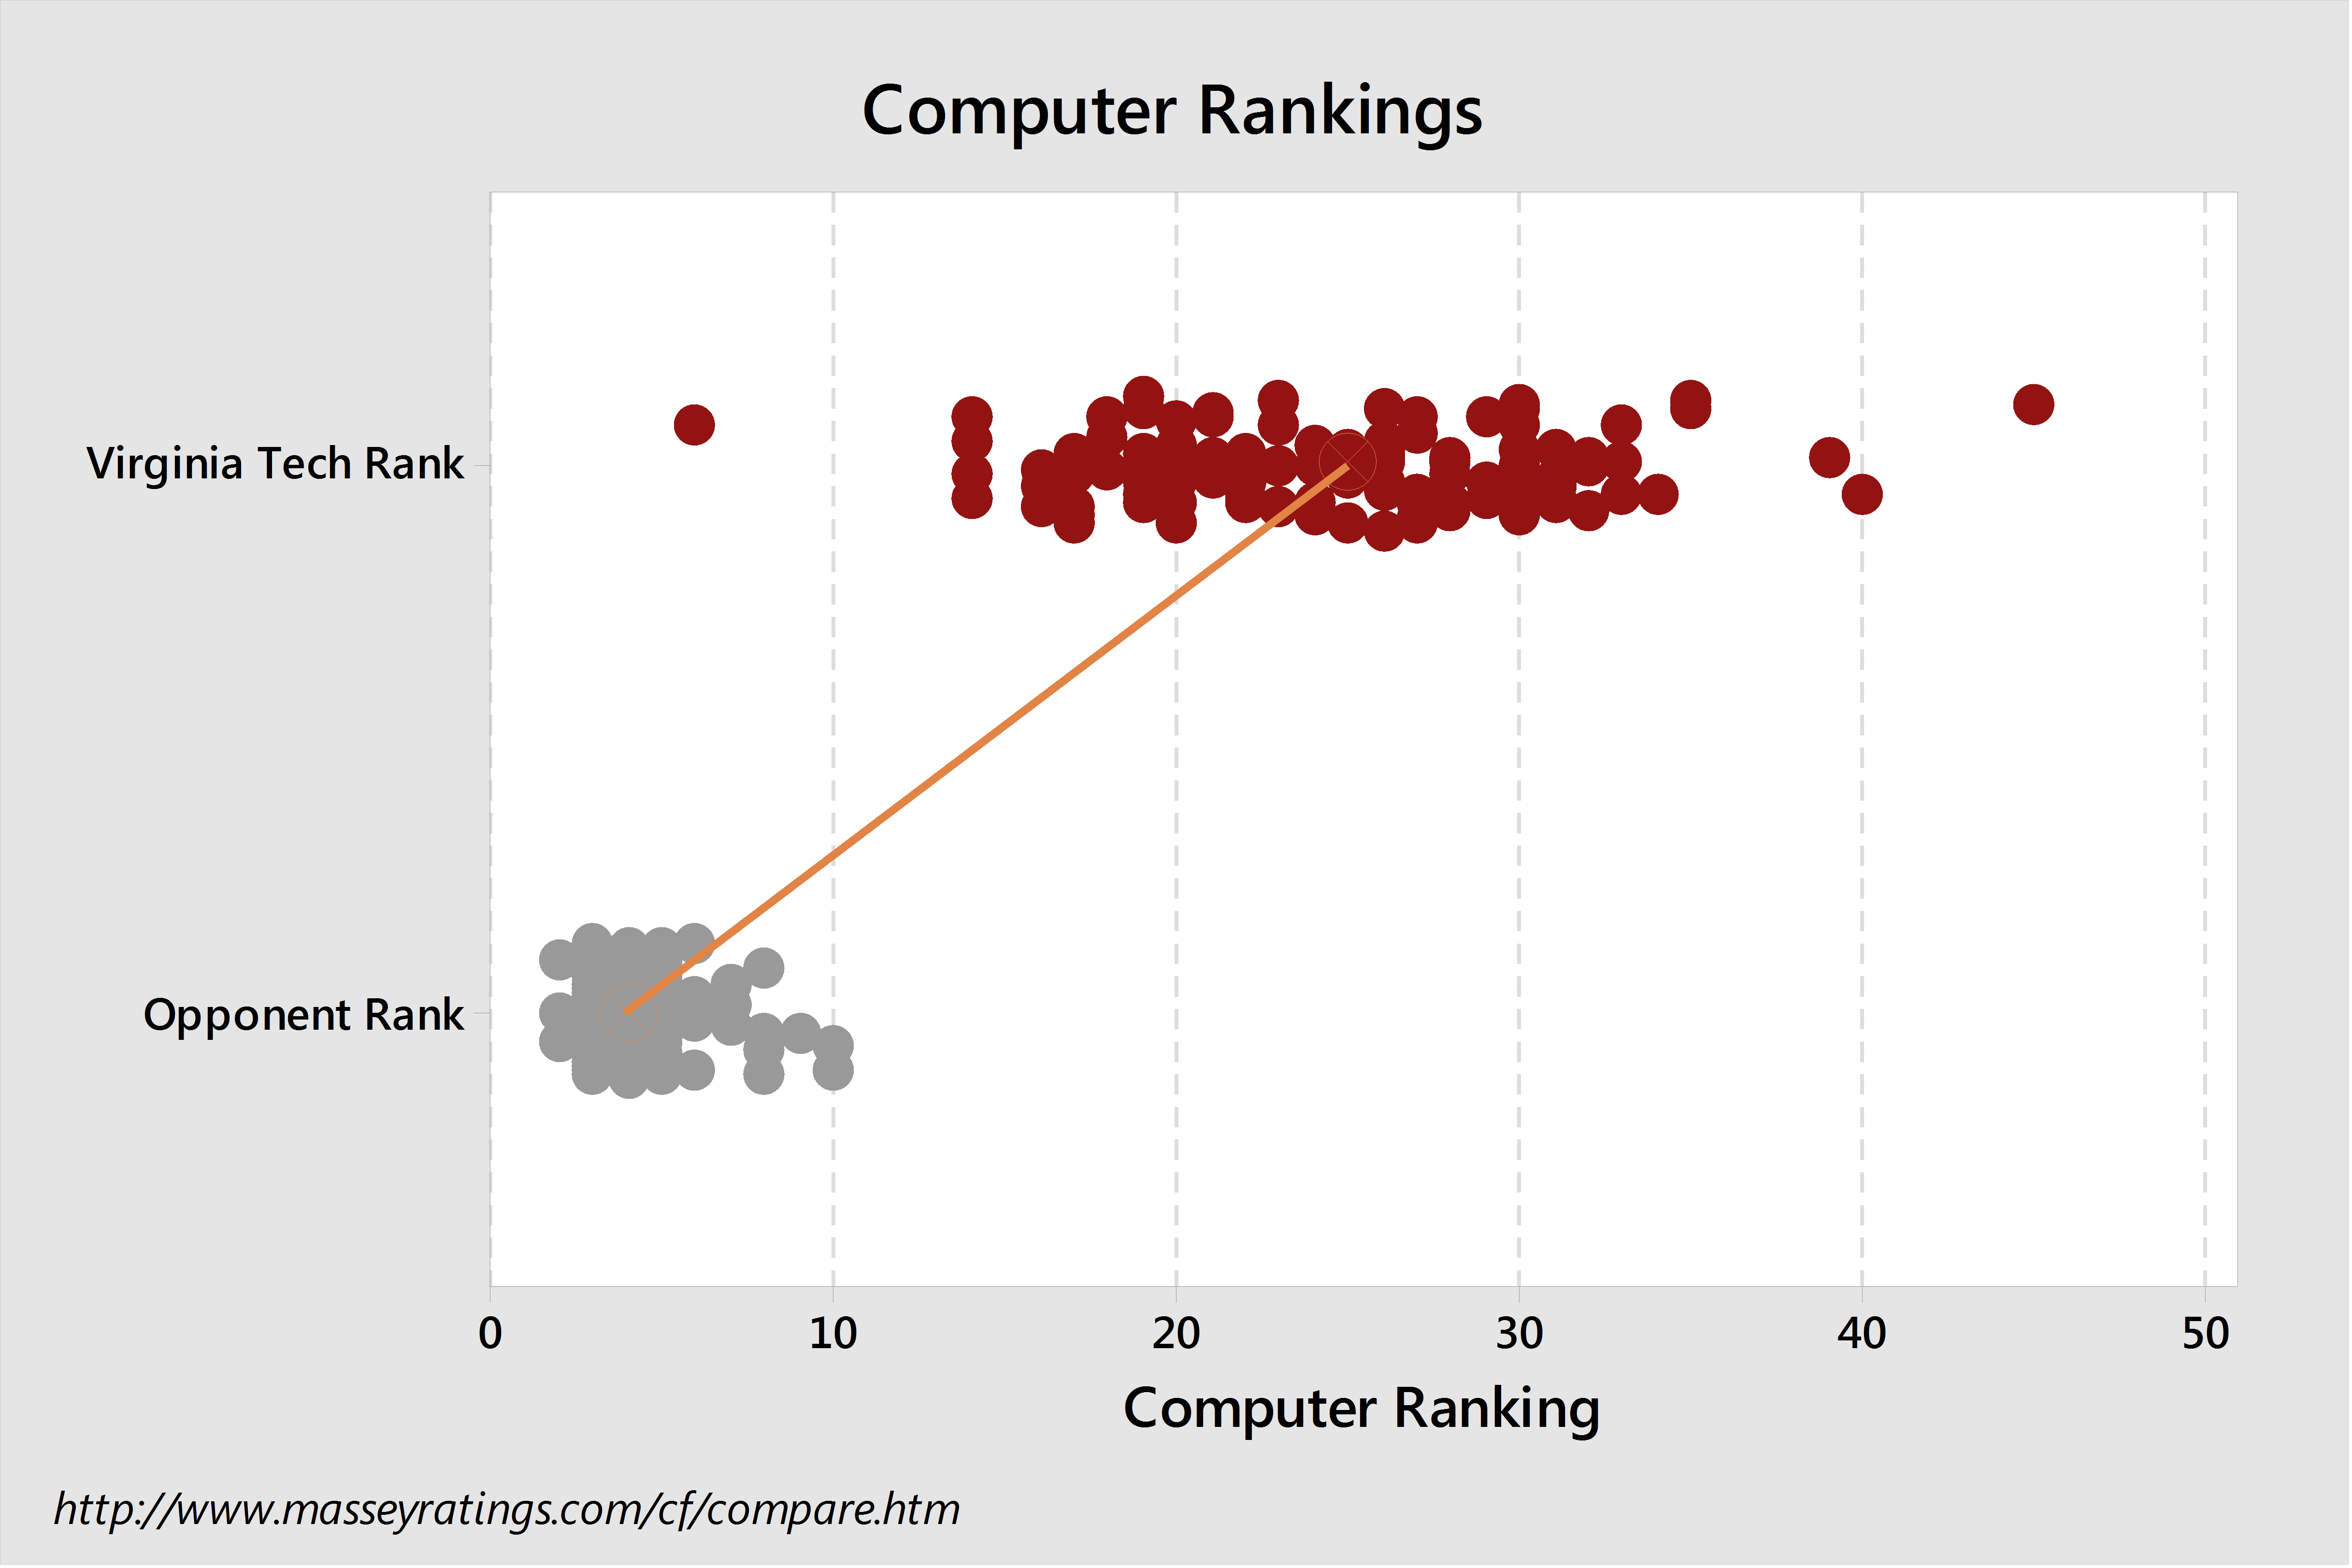
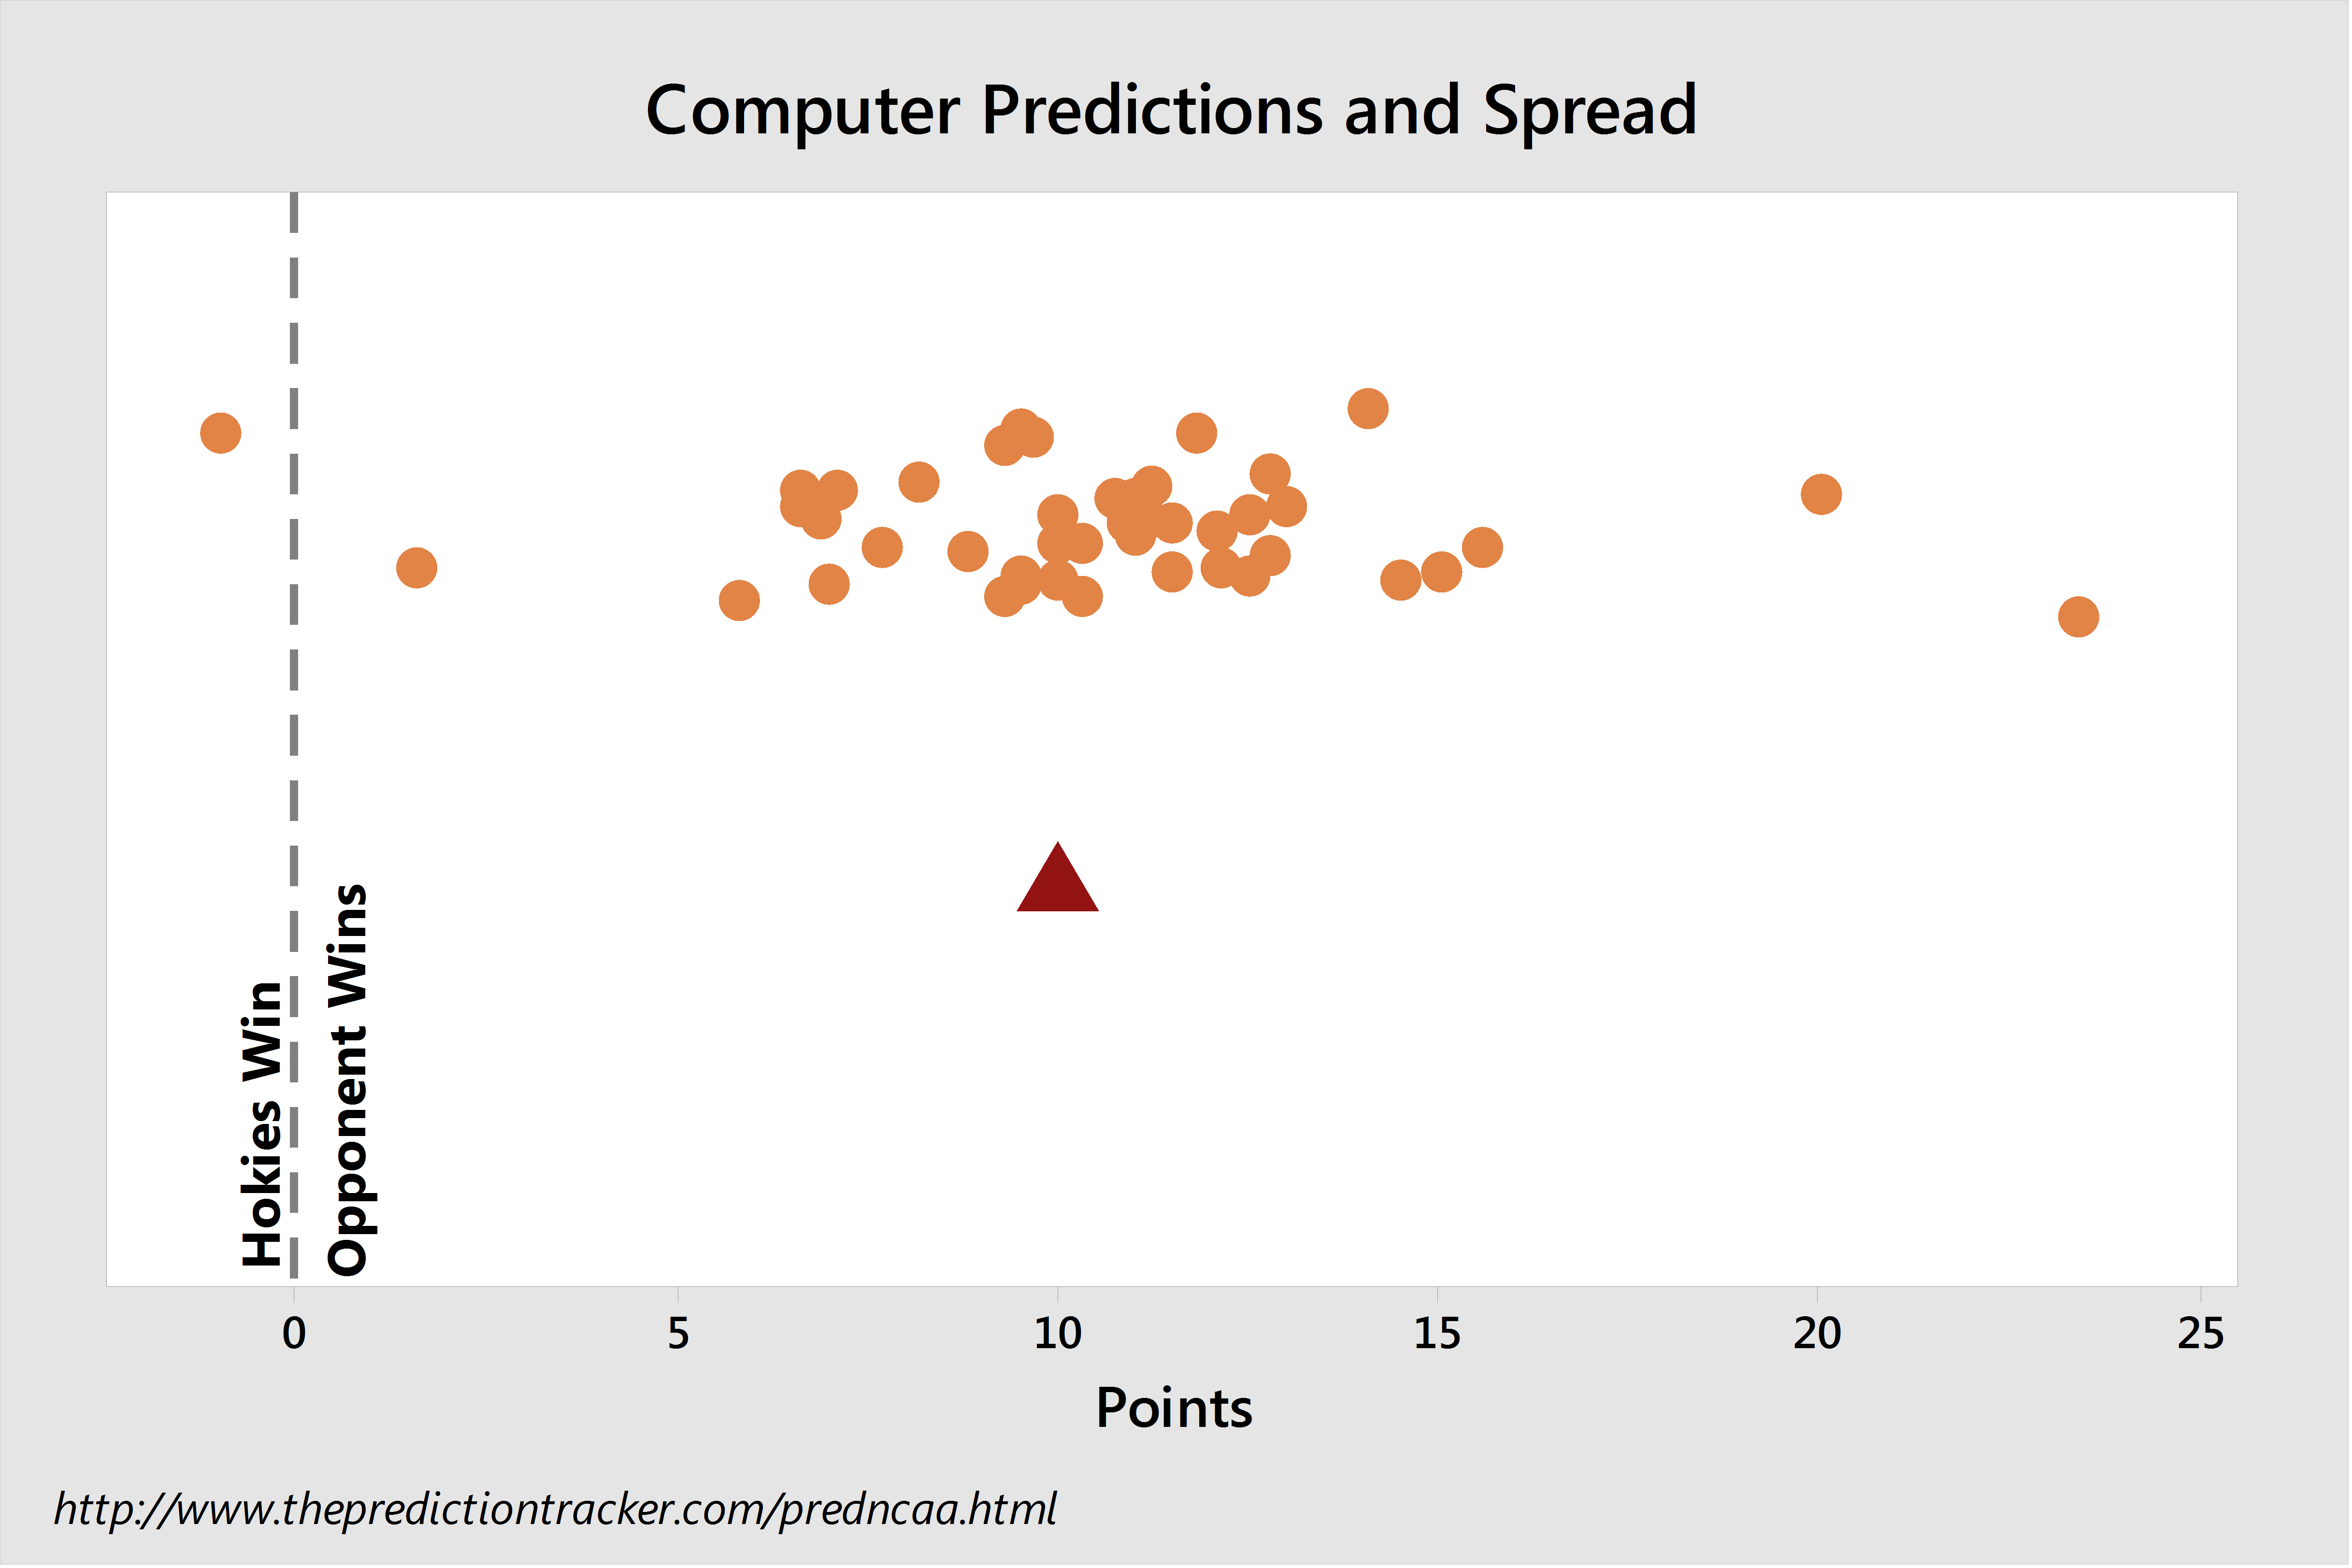
That computer that has Virginia Tech ranked ahead of Clemson is Roundtable and you know it is reliable because it has Oklahoma State at No. 2 and 5 ACC teams in the top 10! On a serious note, that computer is attempting to do what most people seem to think rankings should do, which is make sure that when two teams have played, the team that won is ranked higher than the team that lost as often as possible. So every time someone asks "How come team X is rated behind team Y when they beat them you idiot?!" keep in mind that this system is the kind of results that thinking produces.
The computer predicting a Hokies' win is Catherwood, and I don't know how it works, but it has picked the winner correctly more often than all but three computers on Prediction Tracker. The odds of a 10-point underdog winning are 23.1%.
Next is a look at any overall offensive or defensive advantages:
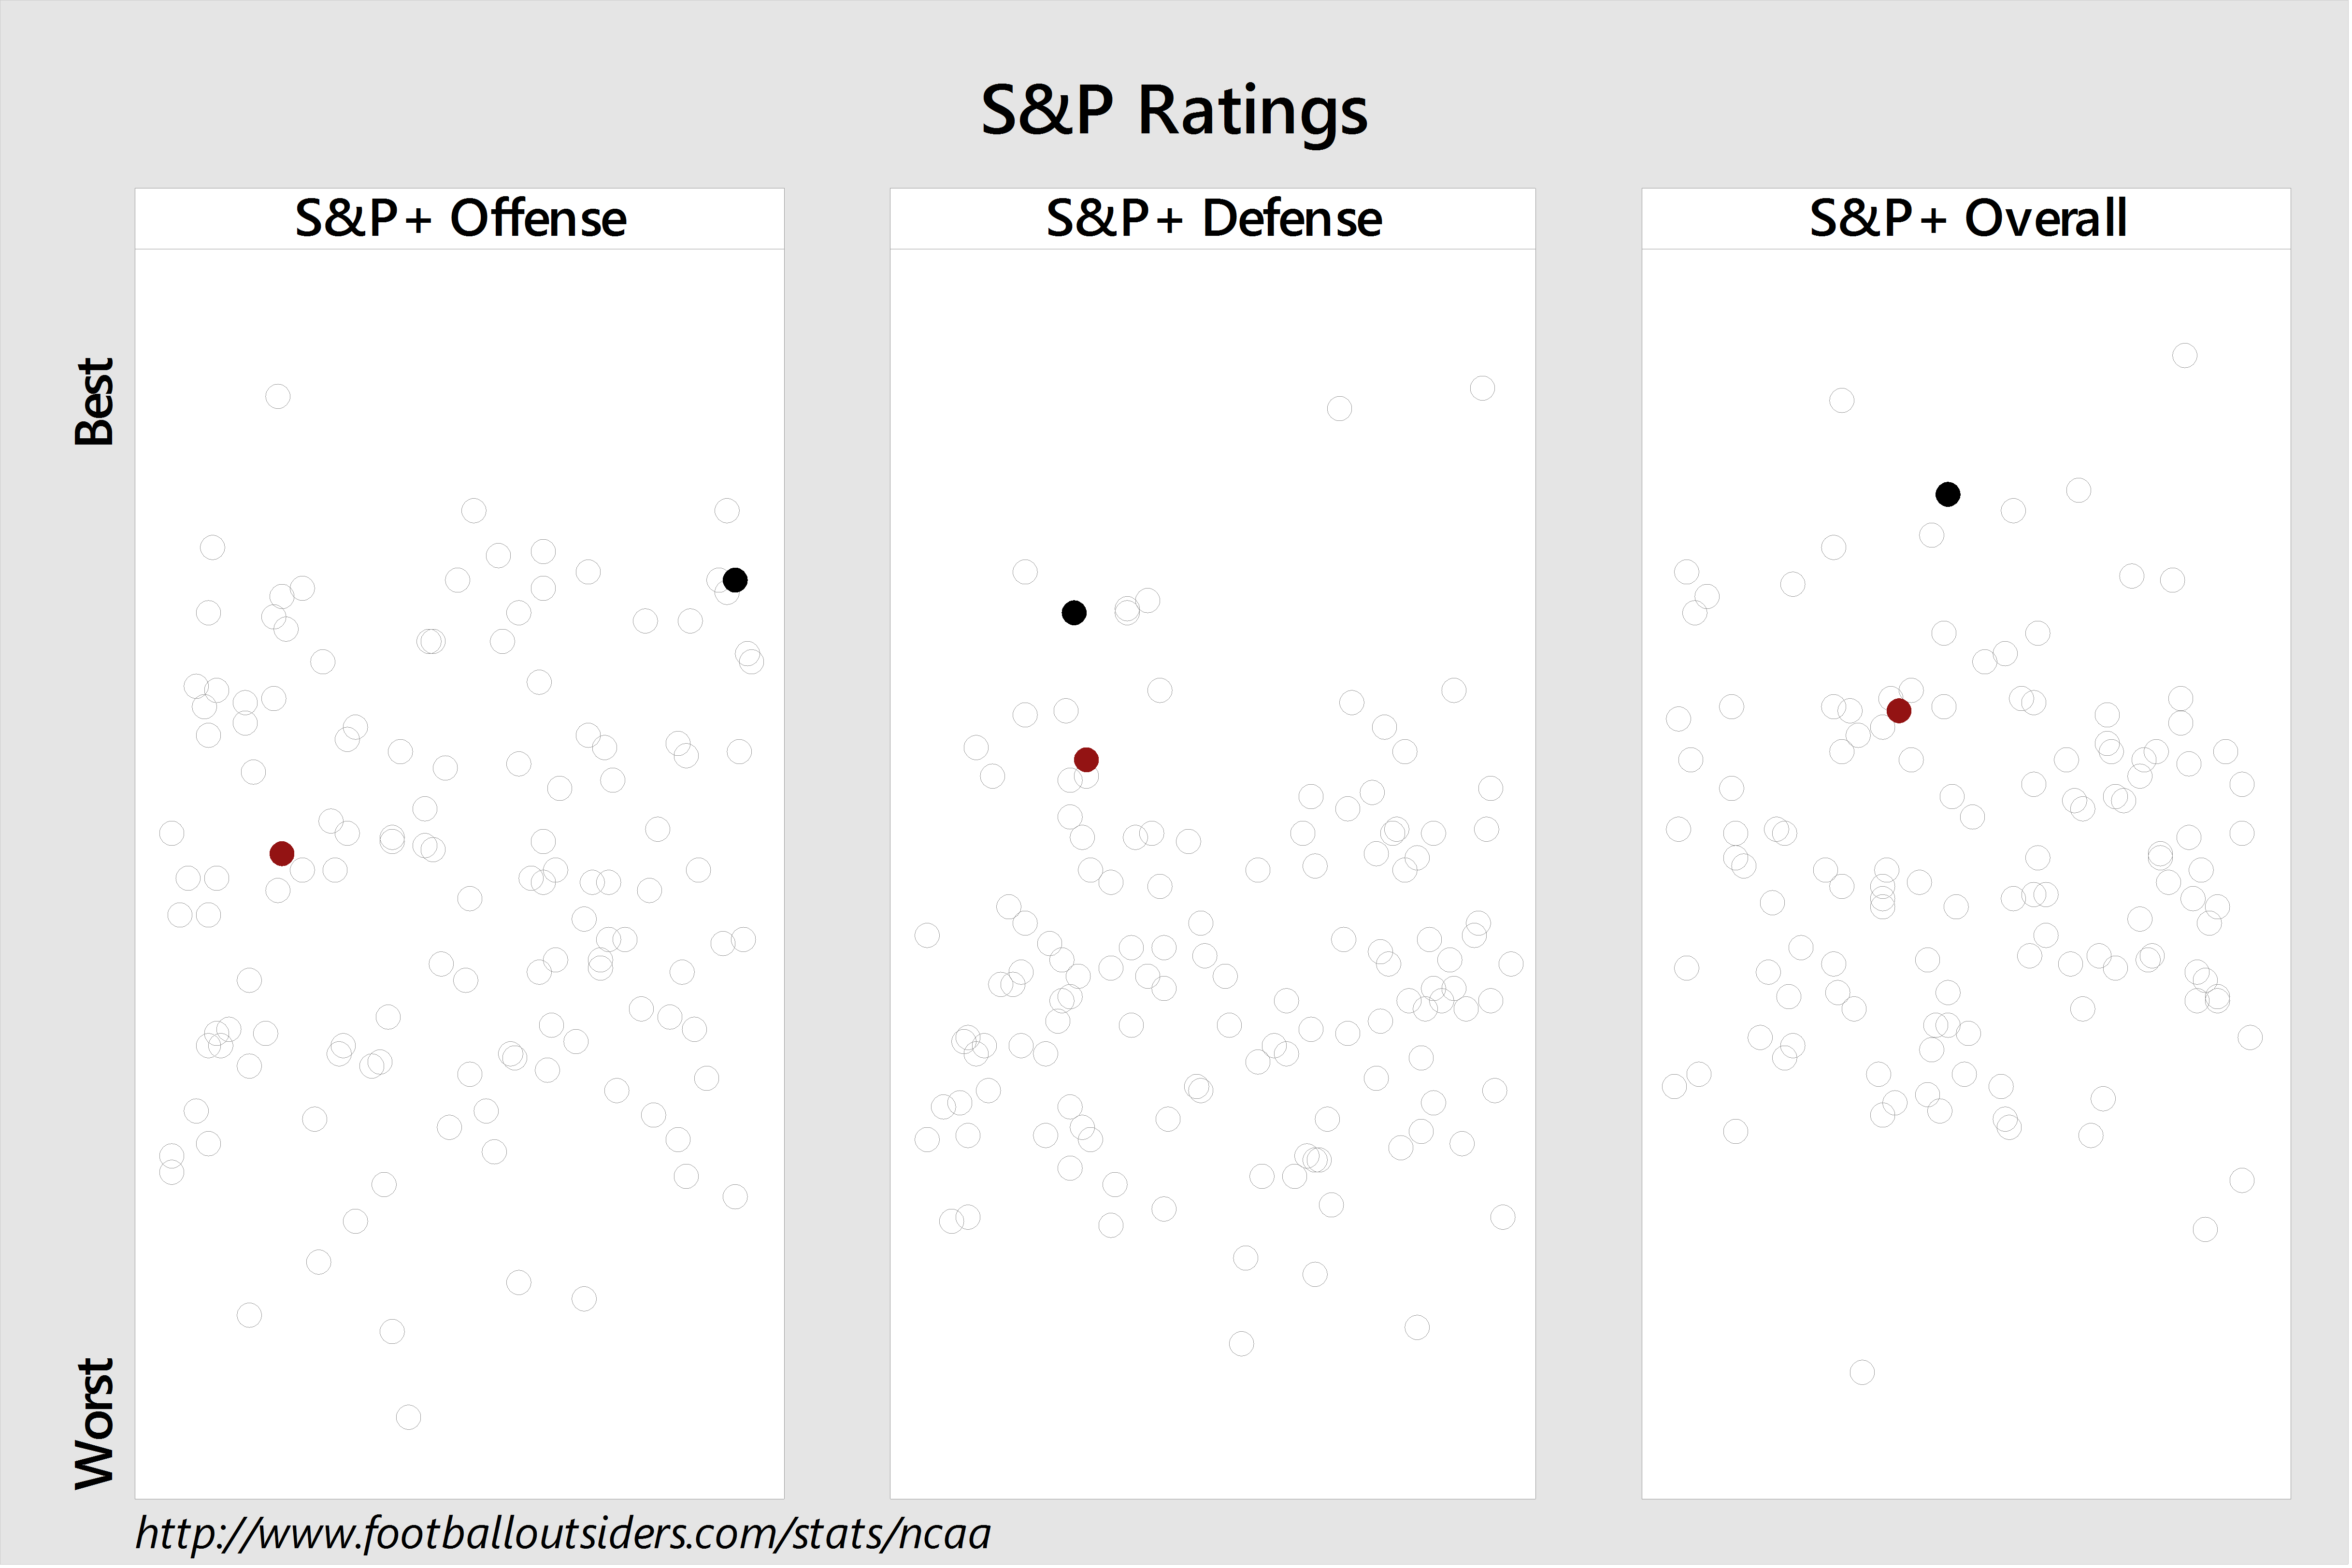
Other than offense, defense, and overall, the Hokies have the advantage in every one of those ratings.
When Virginia Tech Has the Ball
Here is an explanation of S&P+ ratings, and FEI ratings. All statistics are now opponent-adjusted.
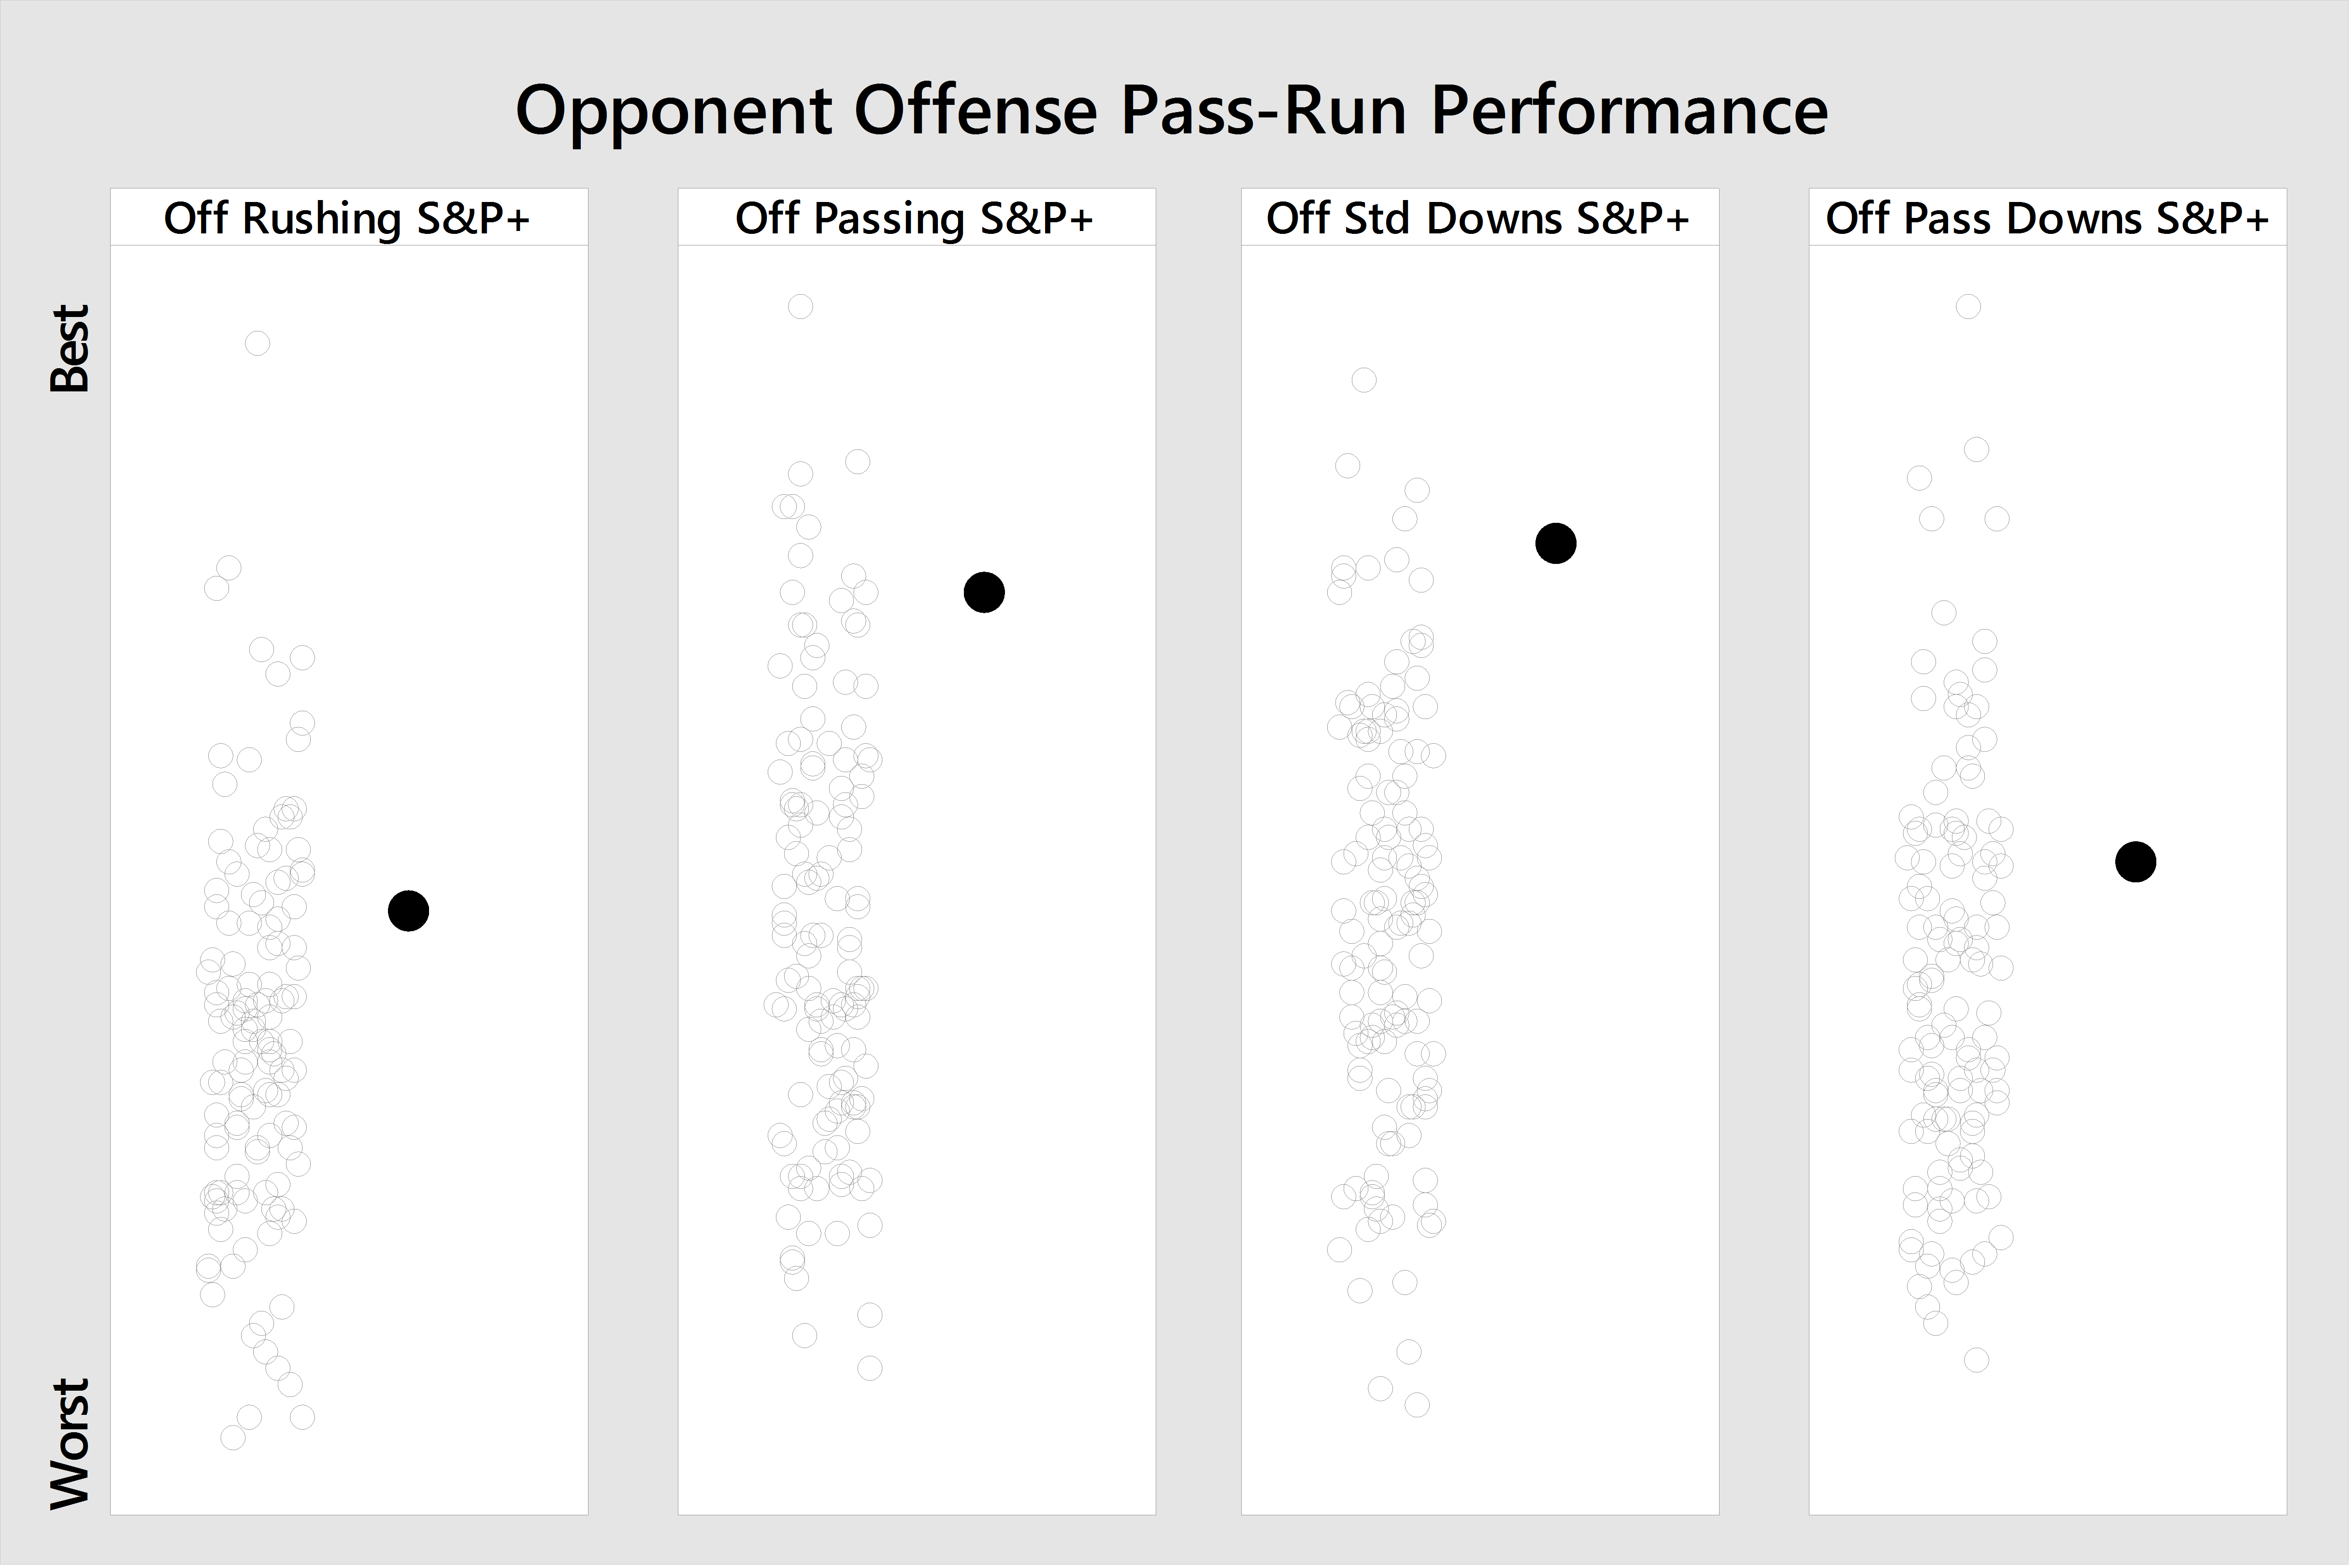
Who has the advantage in the passing and rushing game when the Tech offense has the ball?
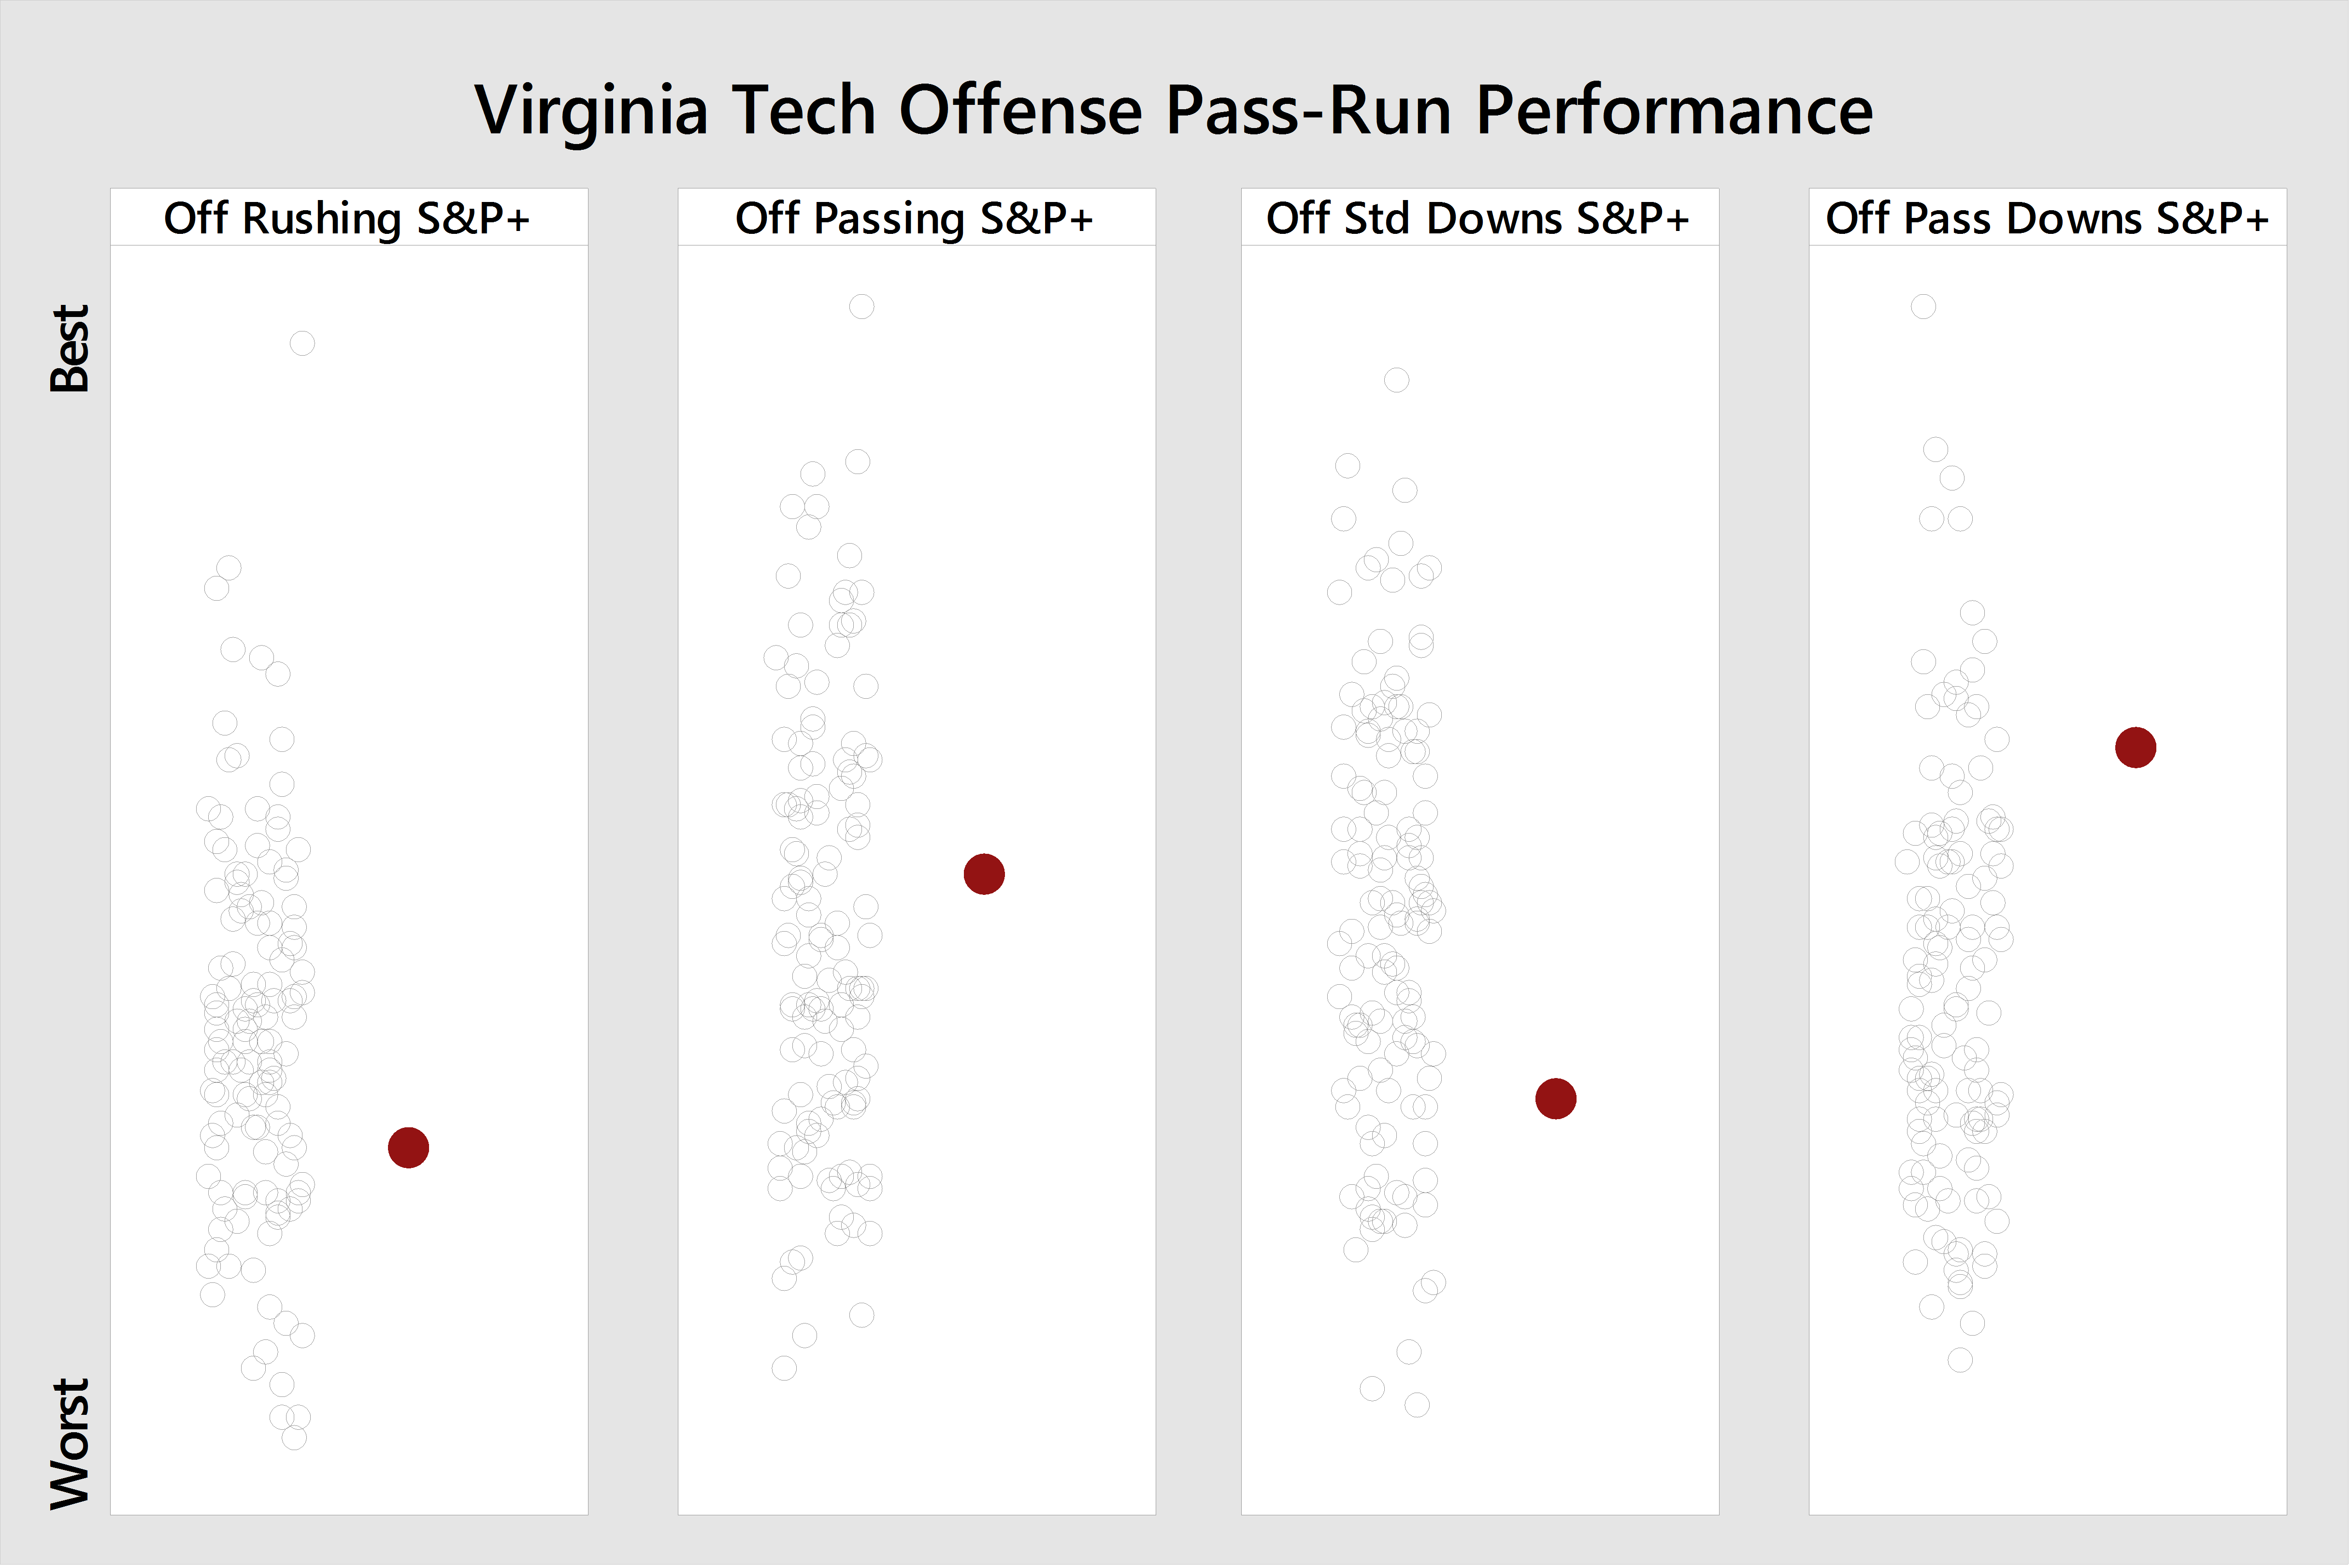
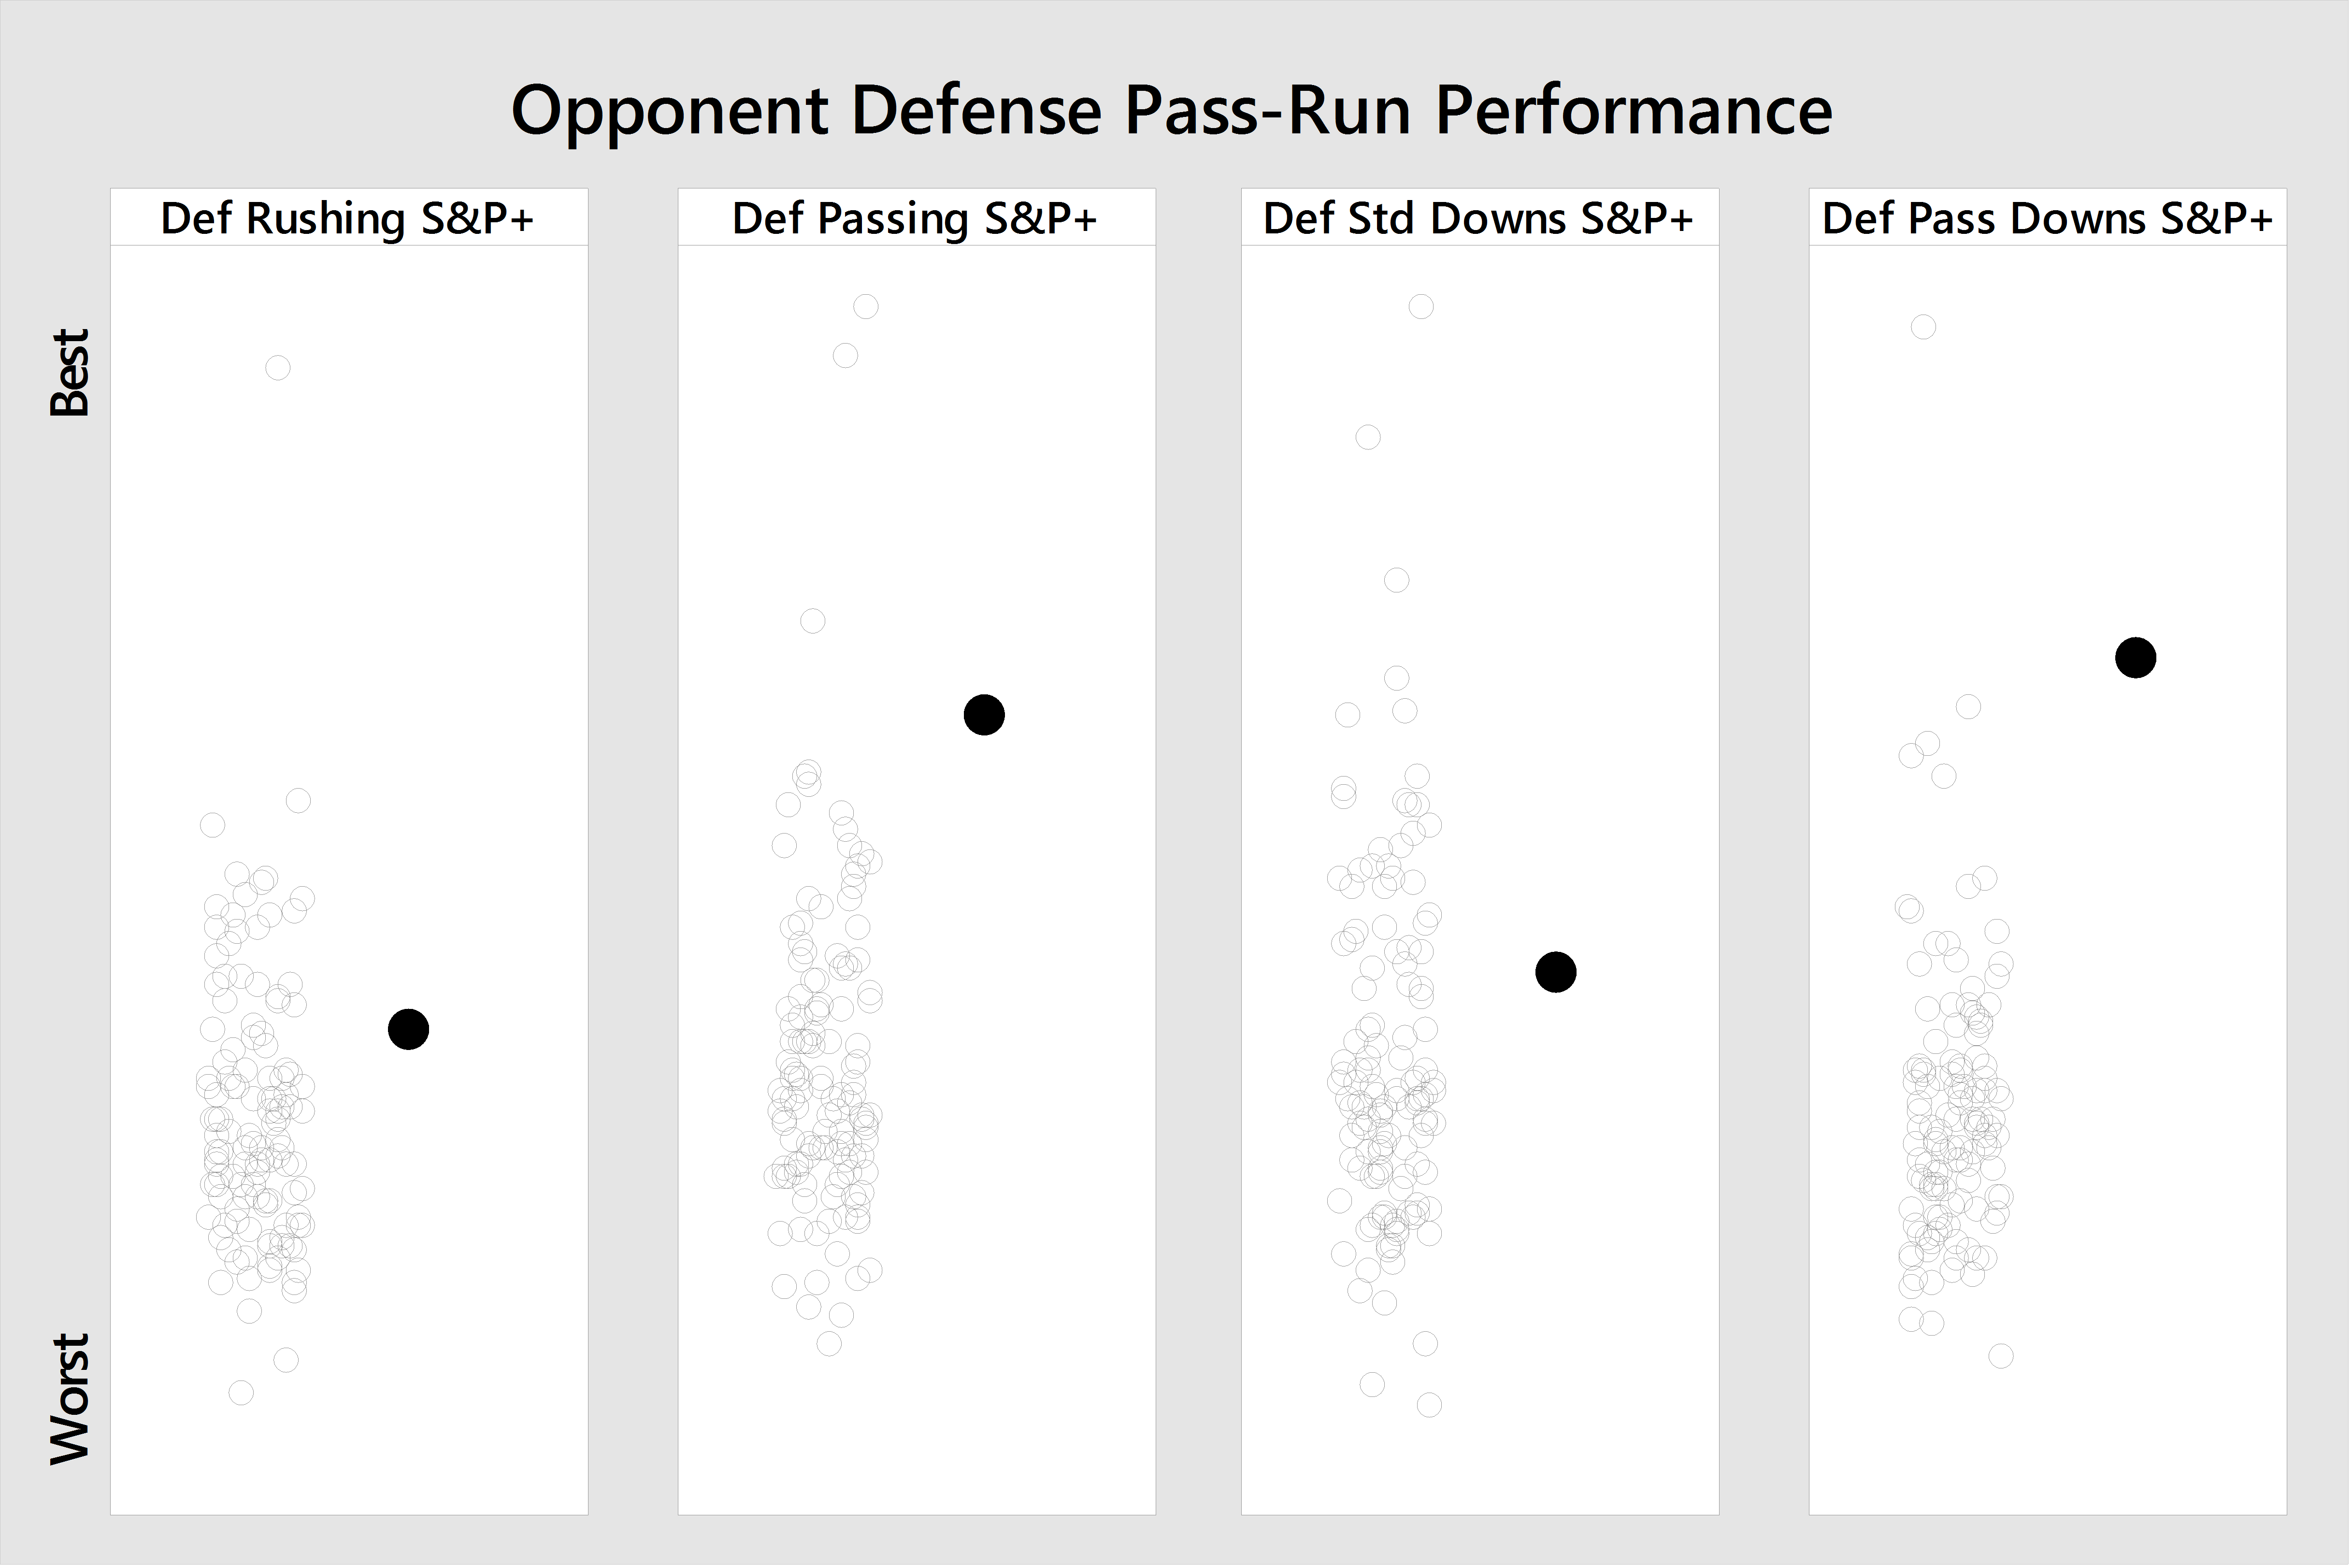
It looks like the strategy of digging a hole every set of downs and then digging right back out could hit a wall this week, as the Tech offense's great passing downs rating is exceeded by that of the Tigers' defense.
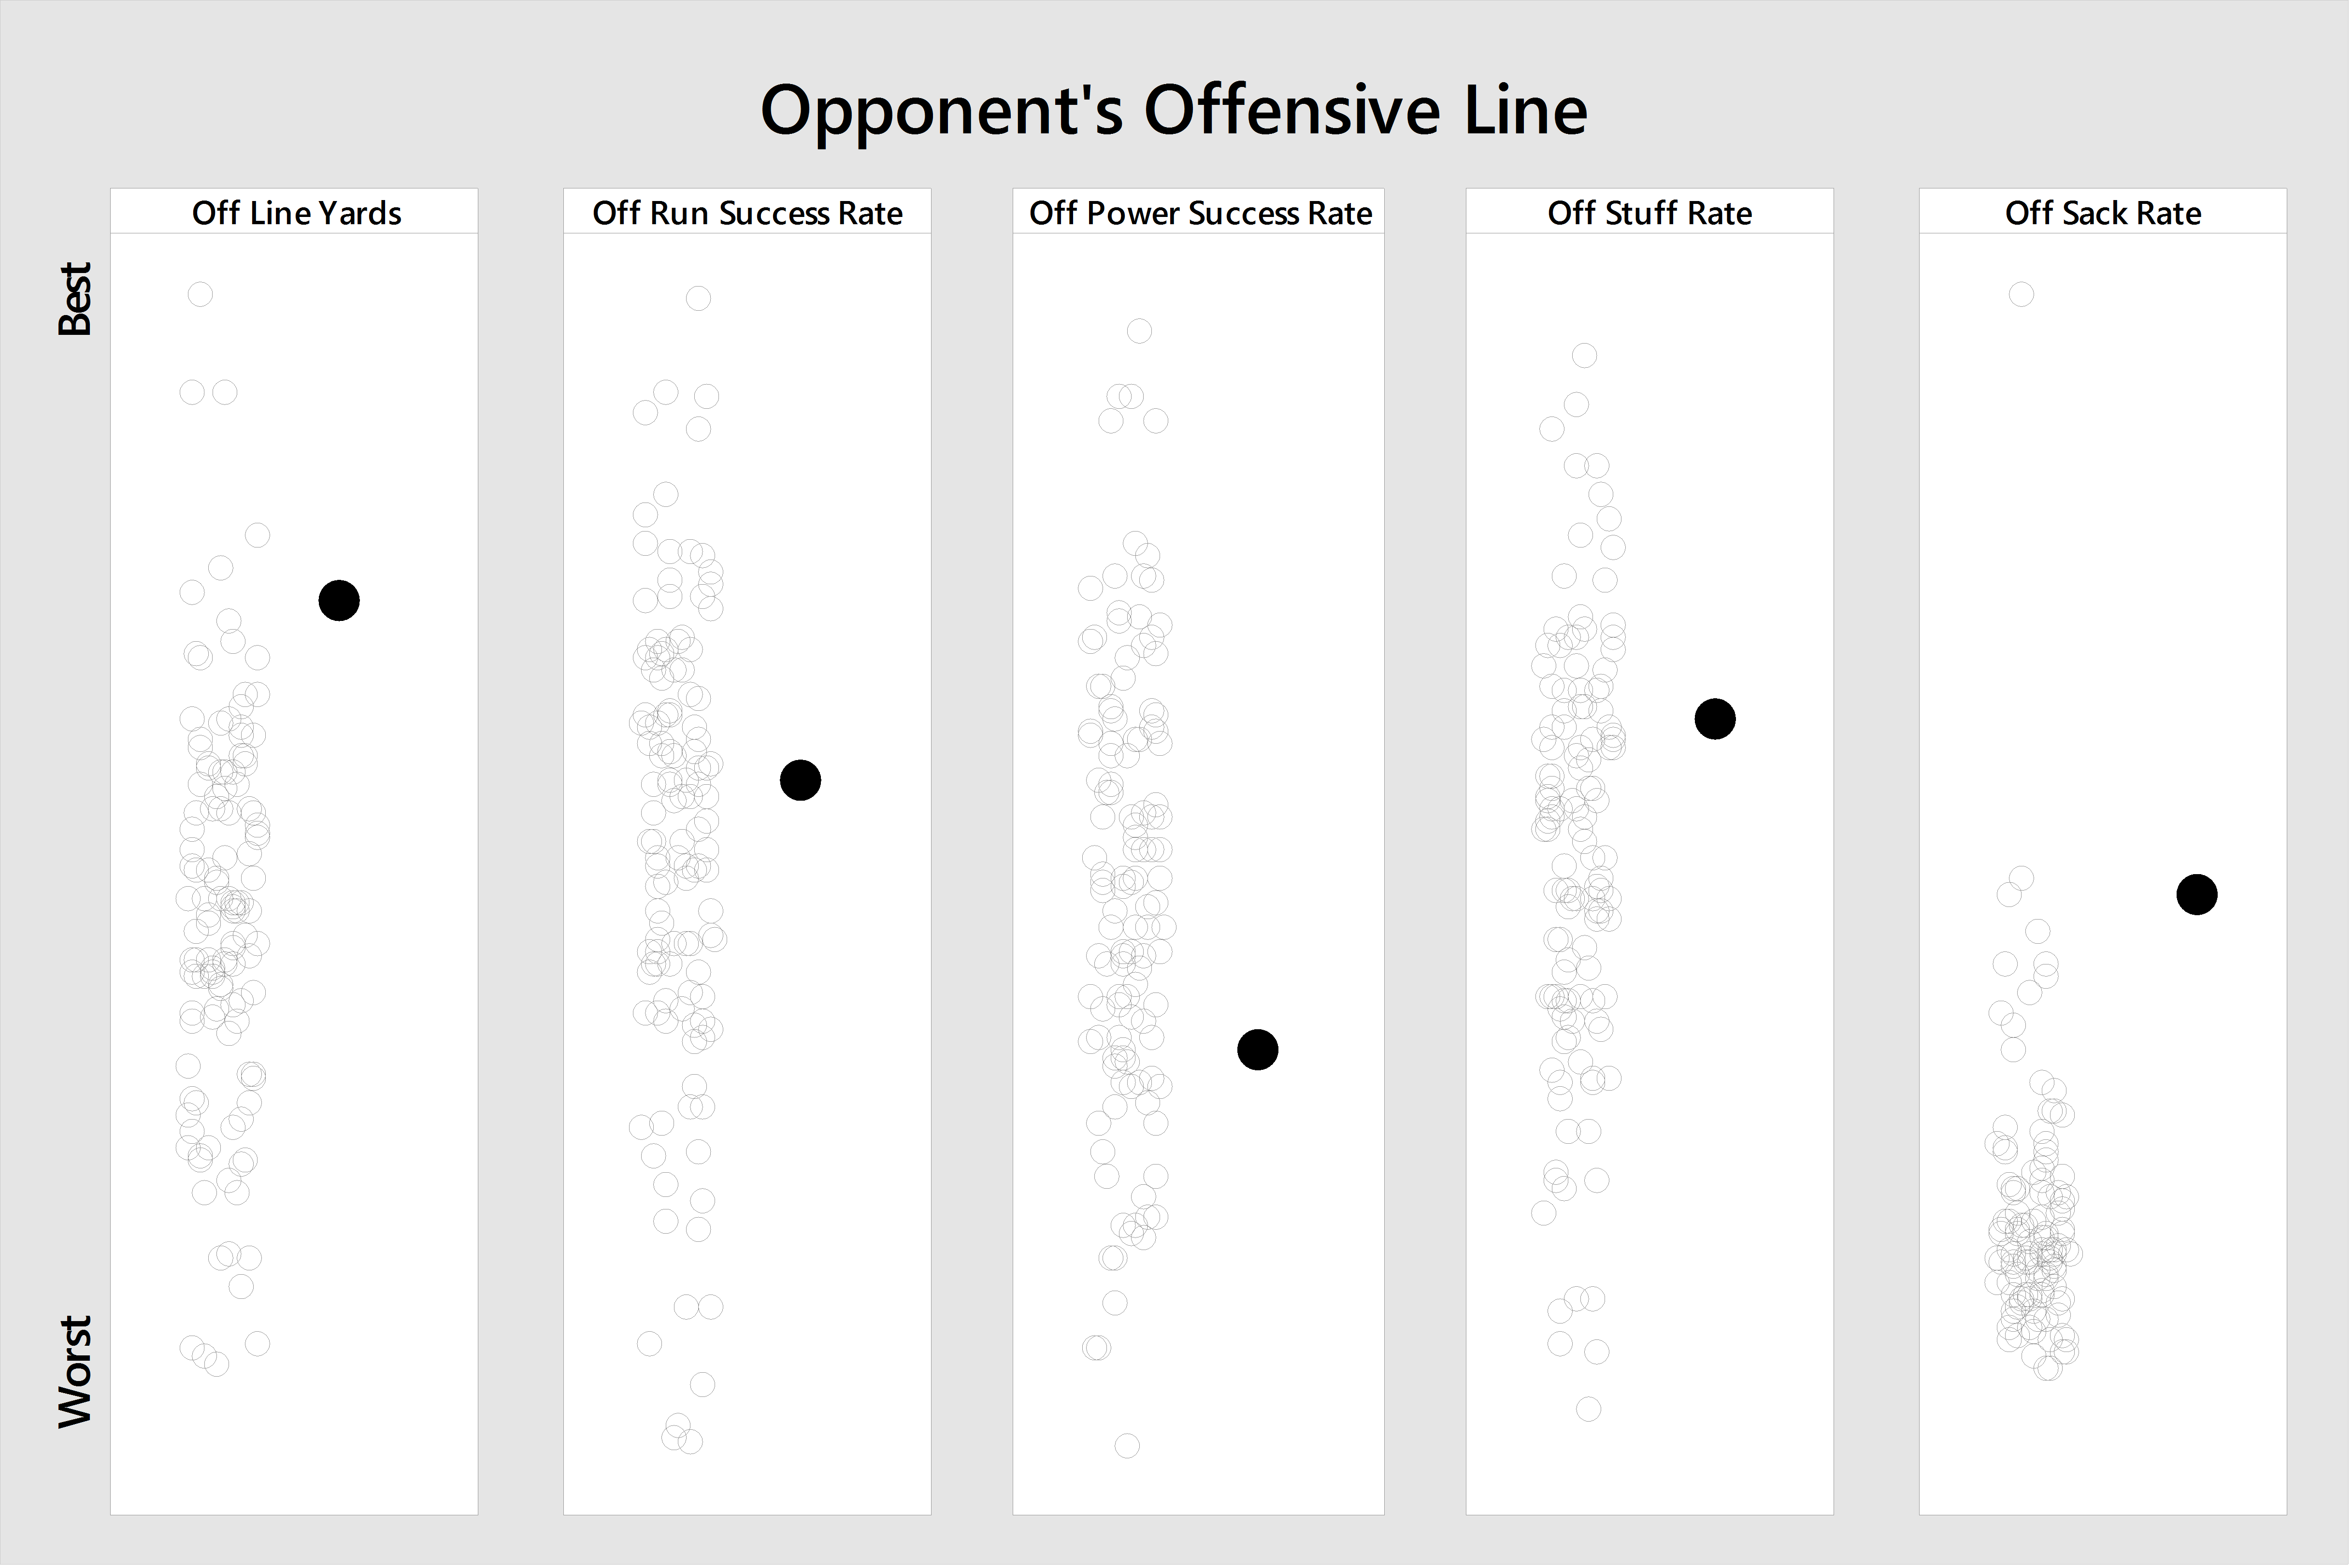
Offensive and defensive line performance are compared using Football Outsiders' metrics:
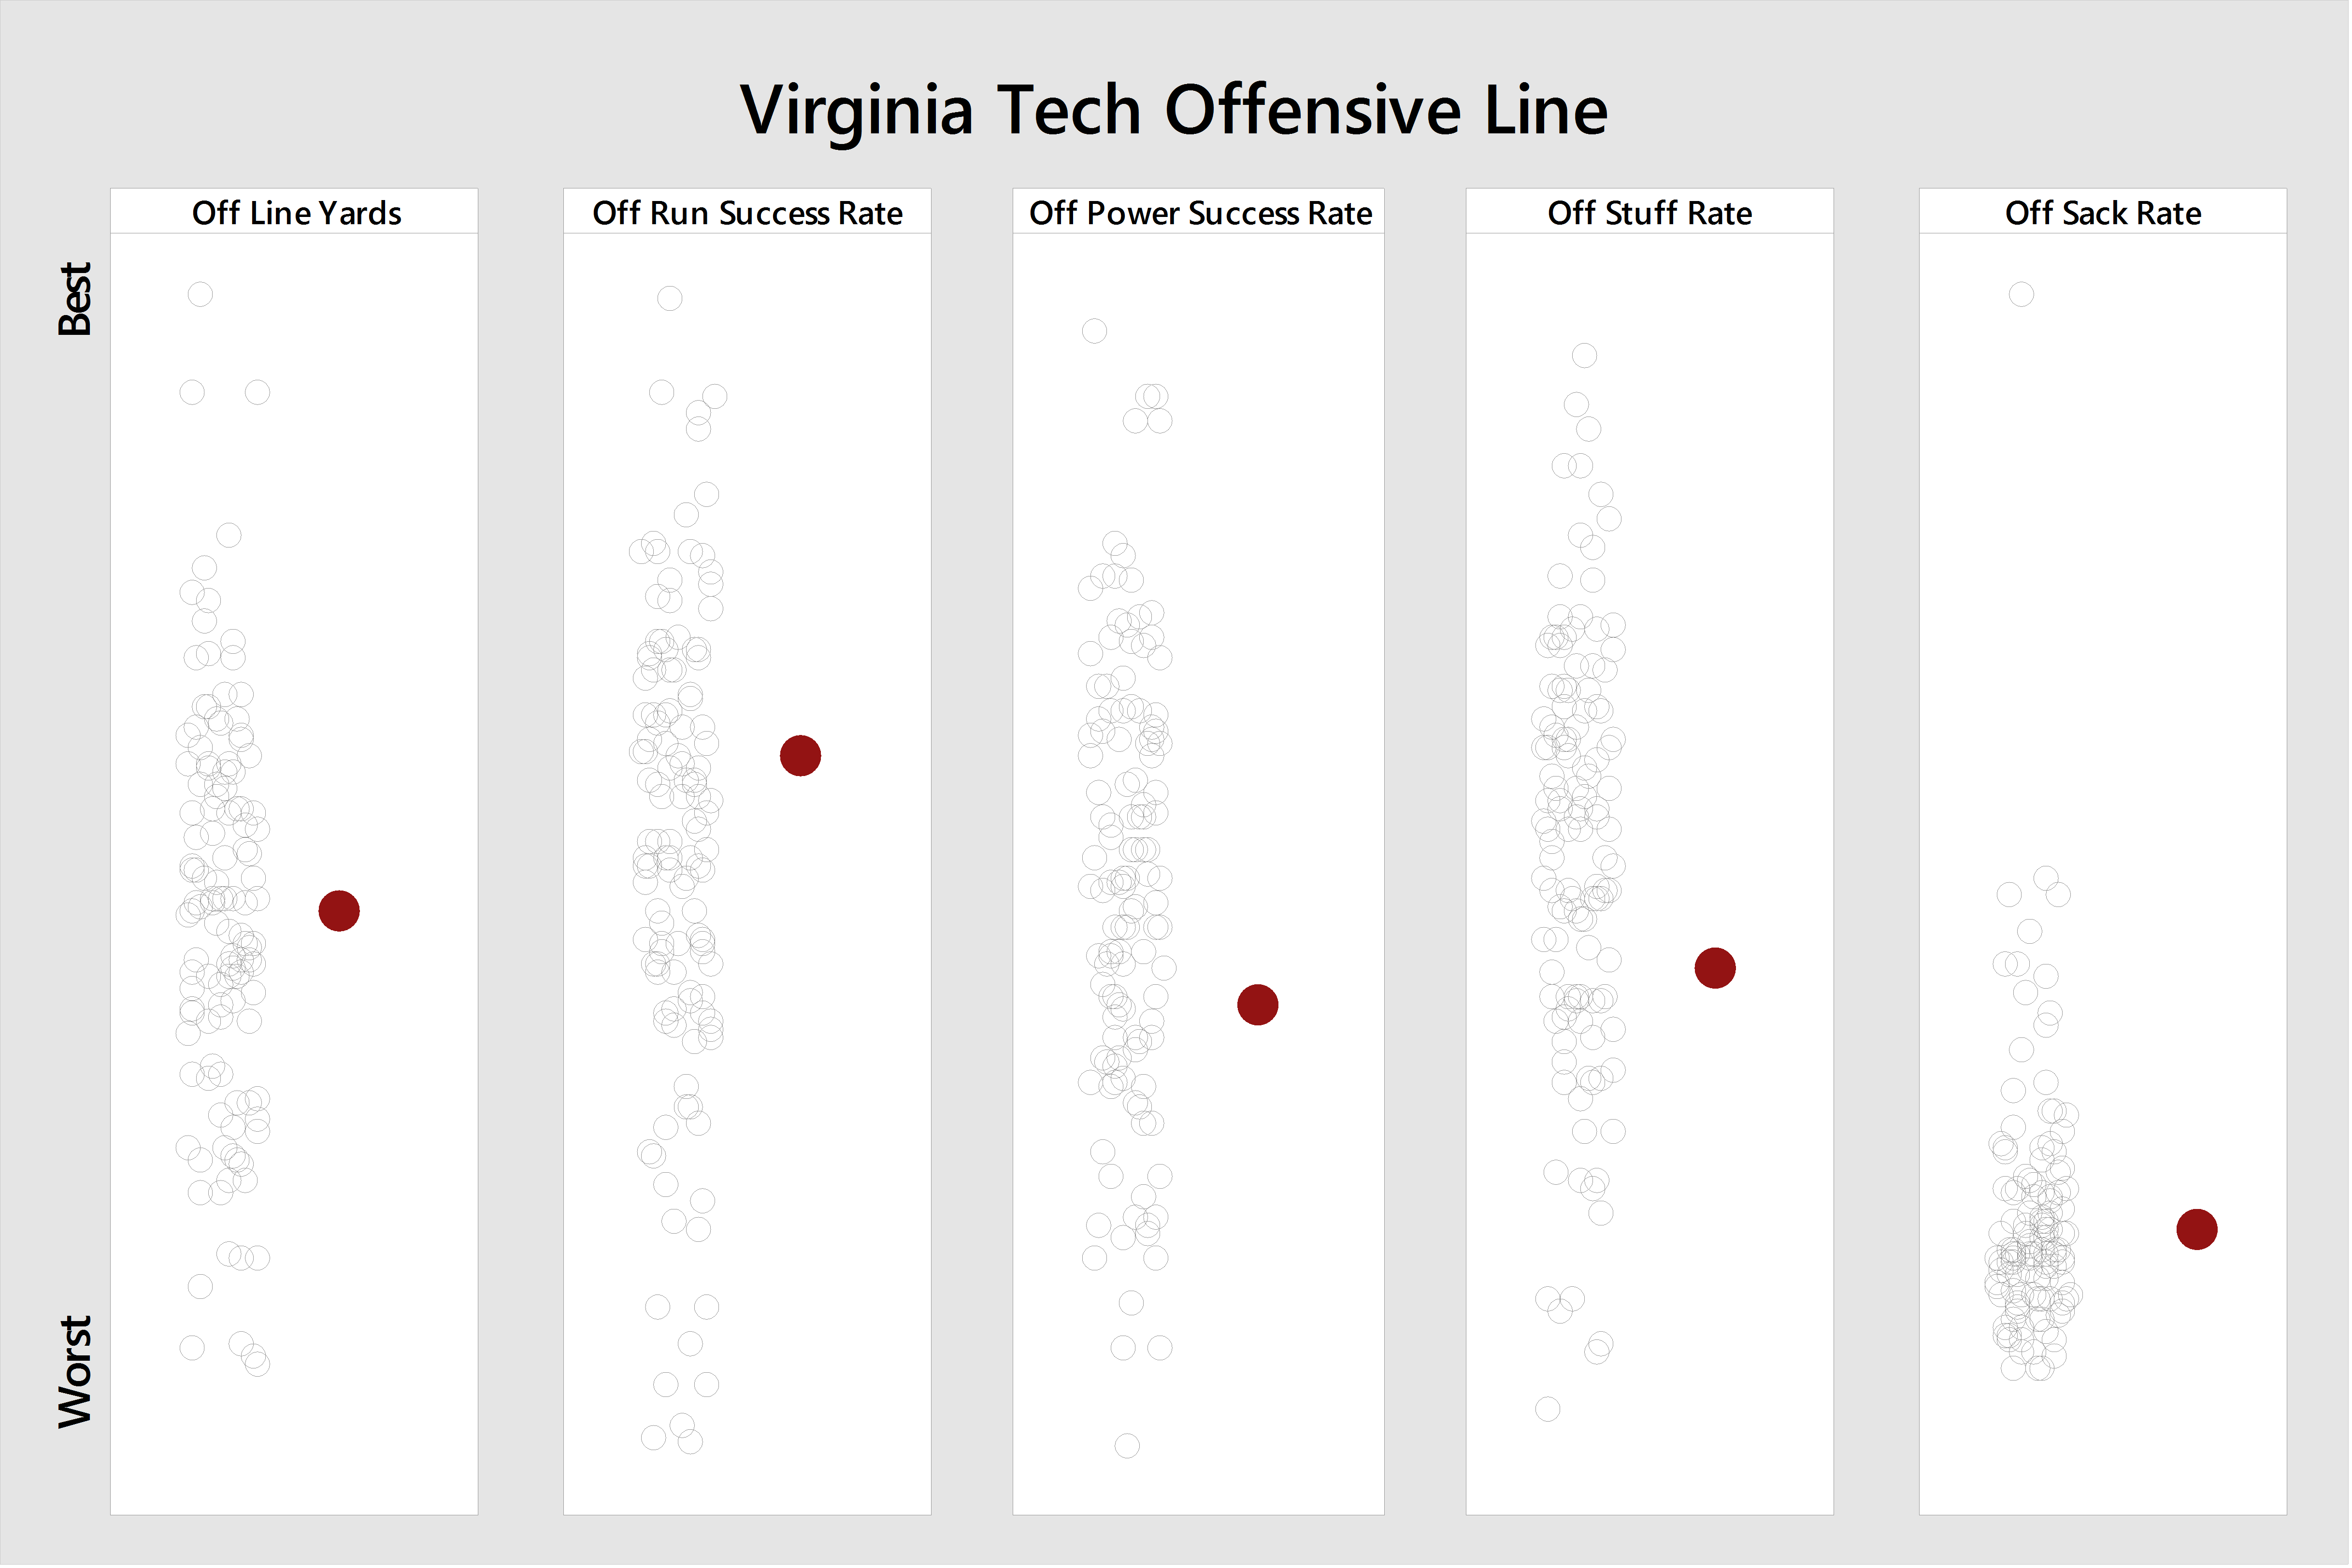
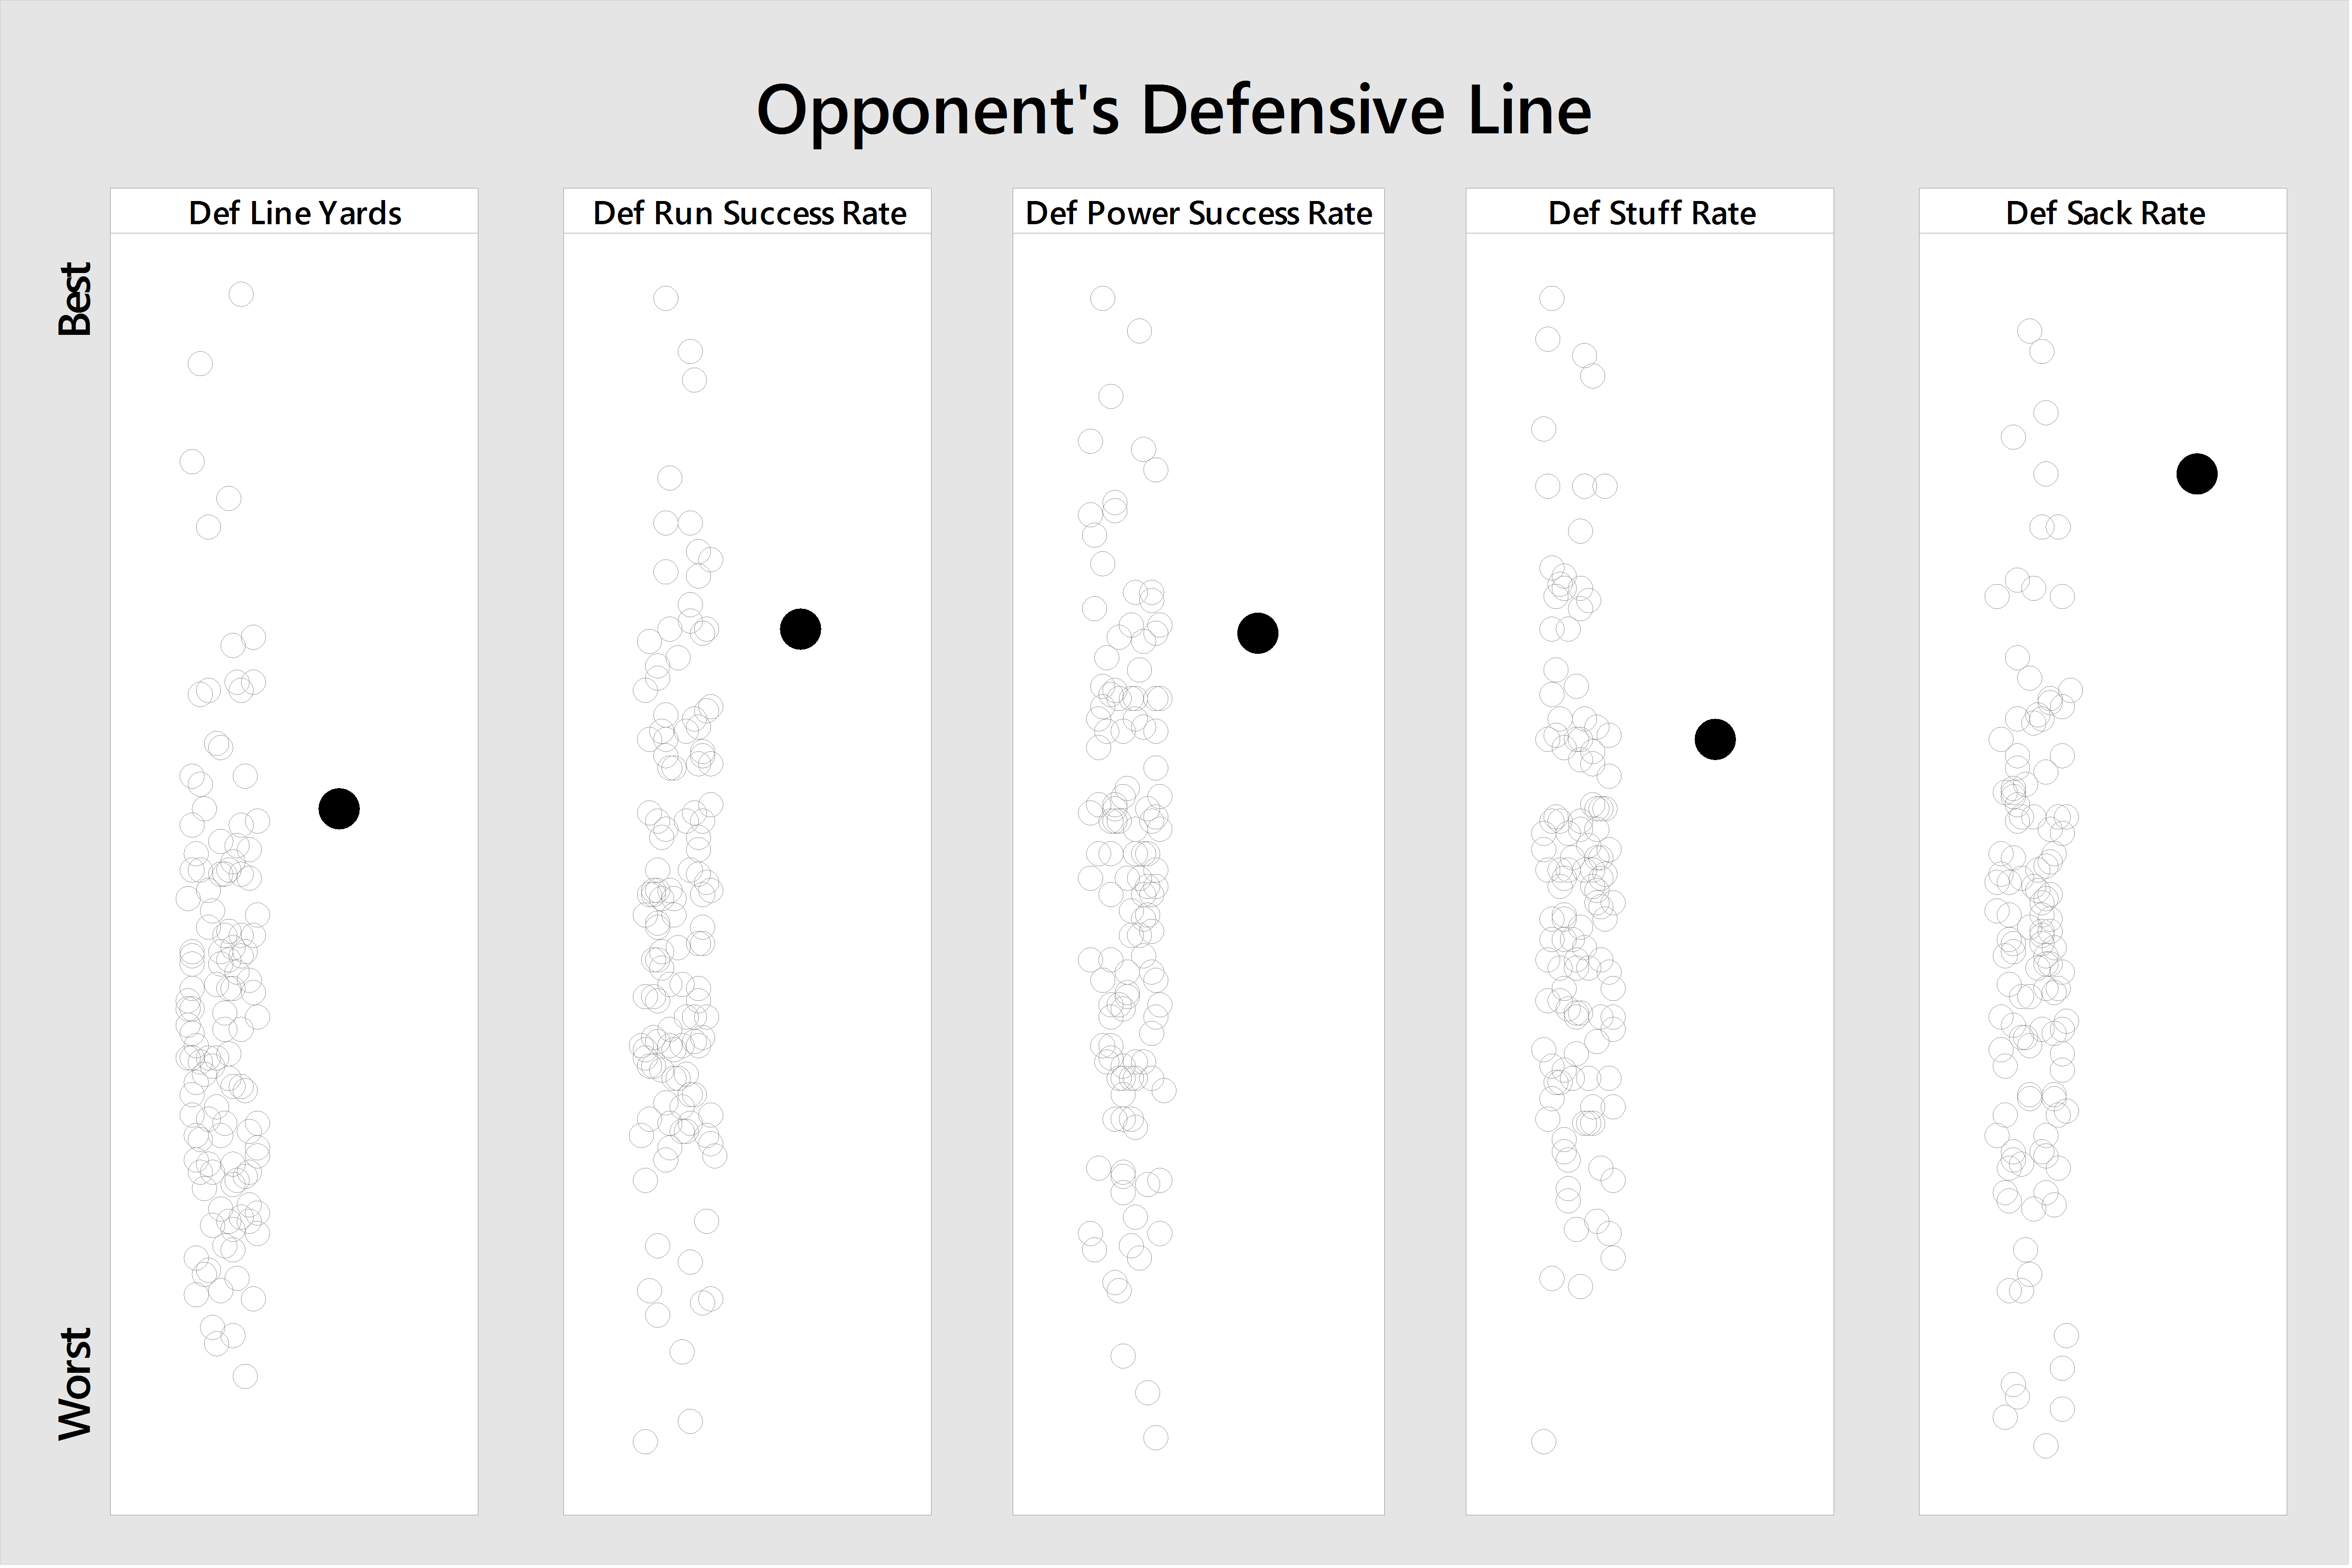
Now let's take a look at the FEI personality traits of the Hokies' offense versus the Tigers' defense:
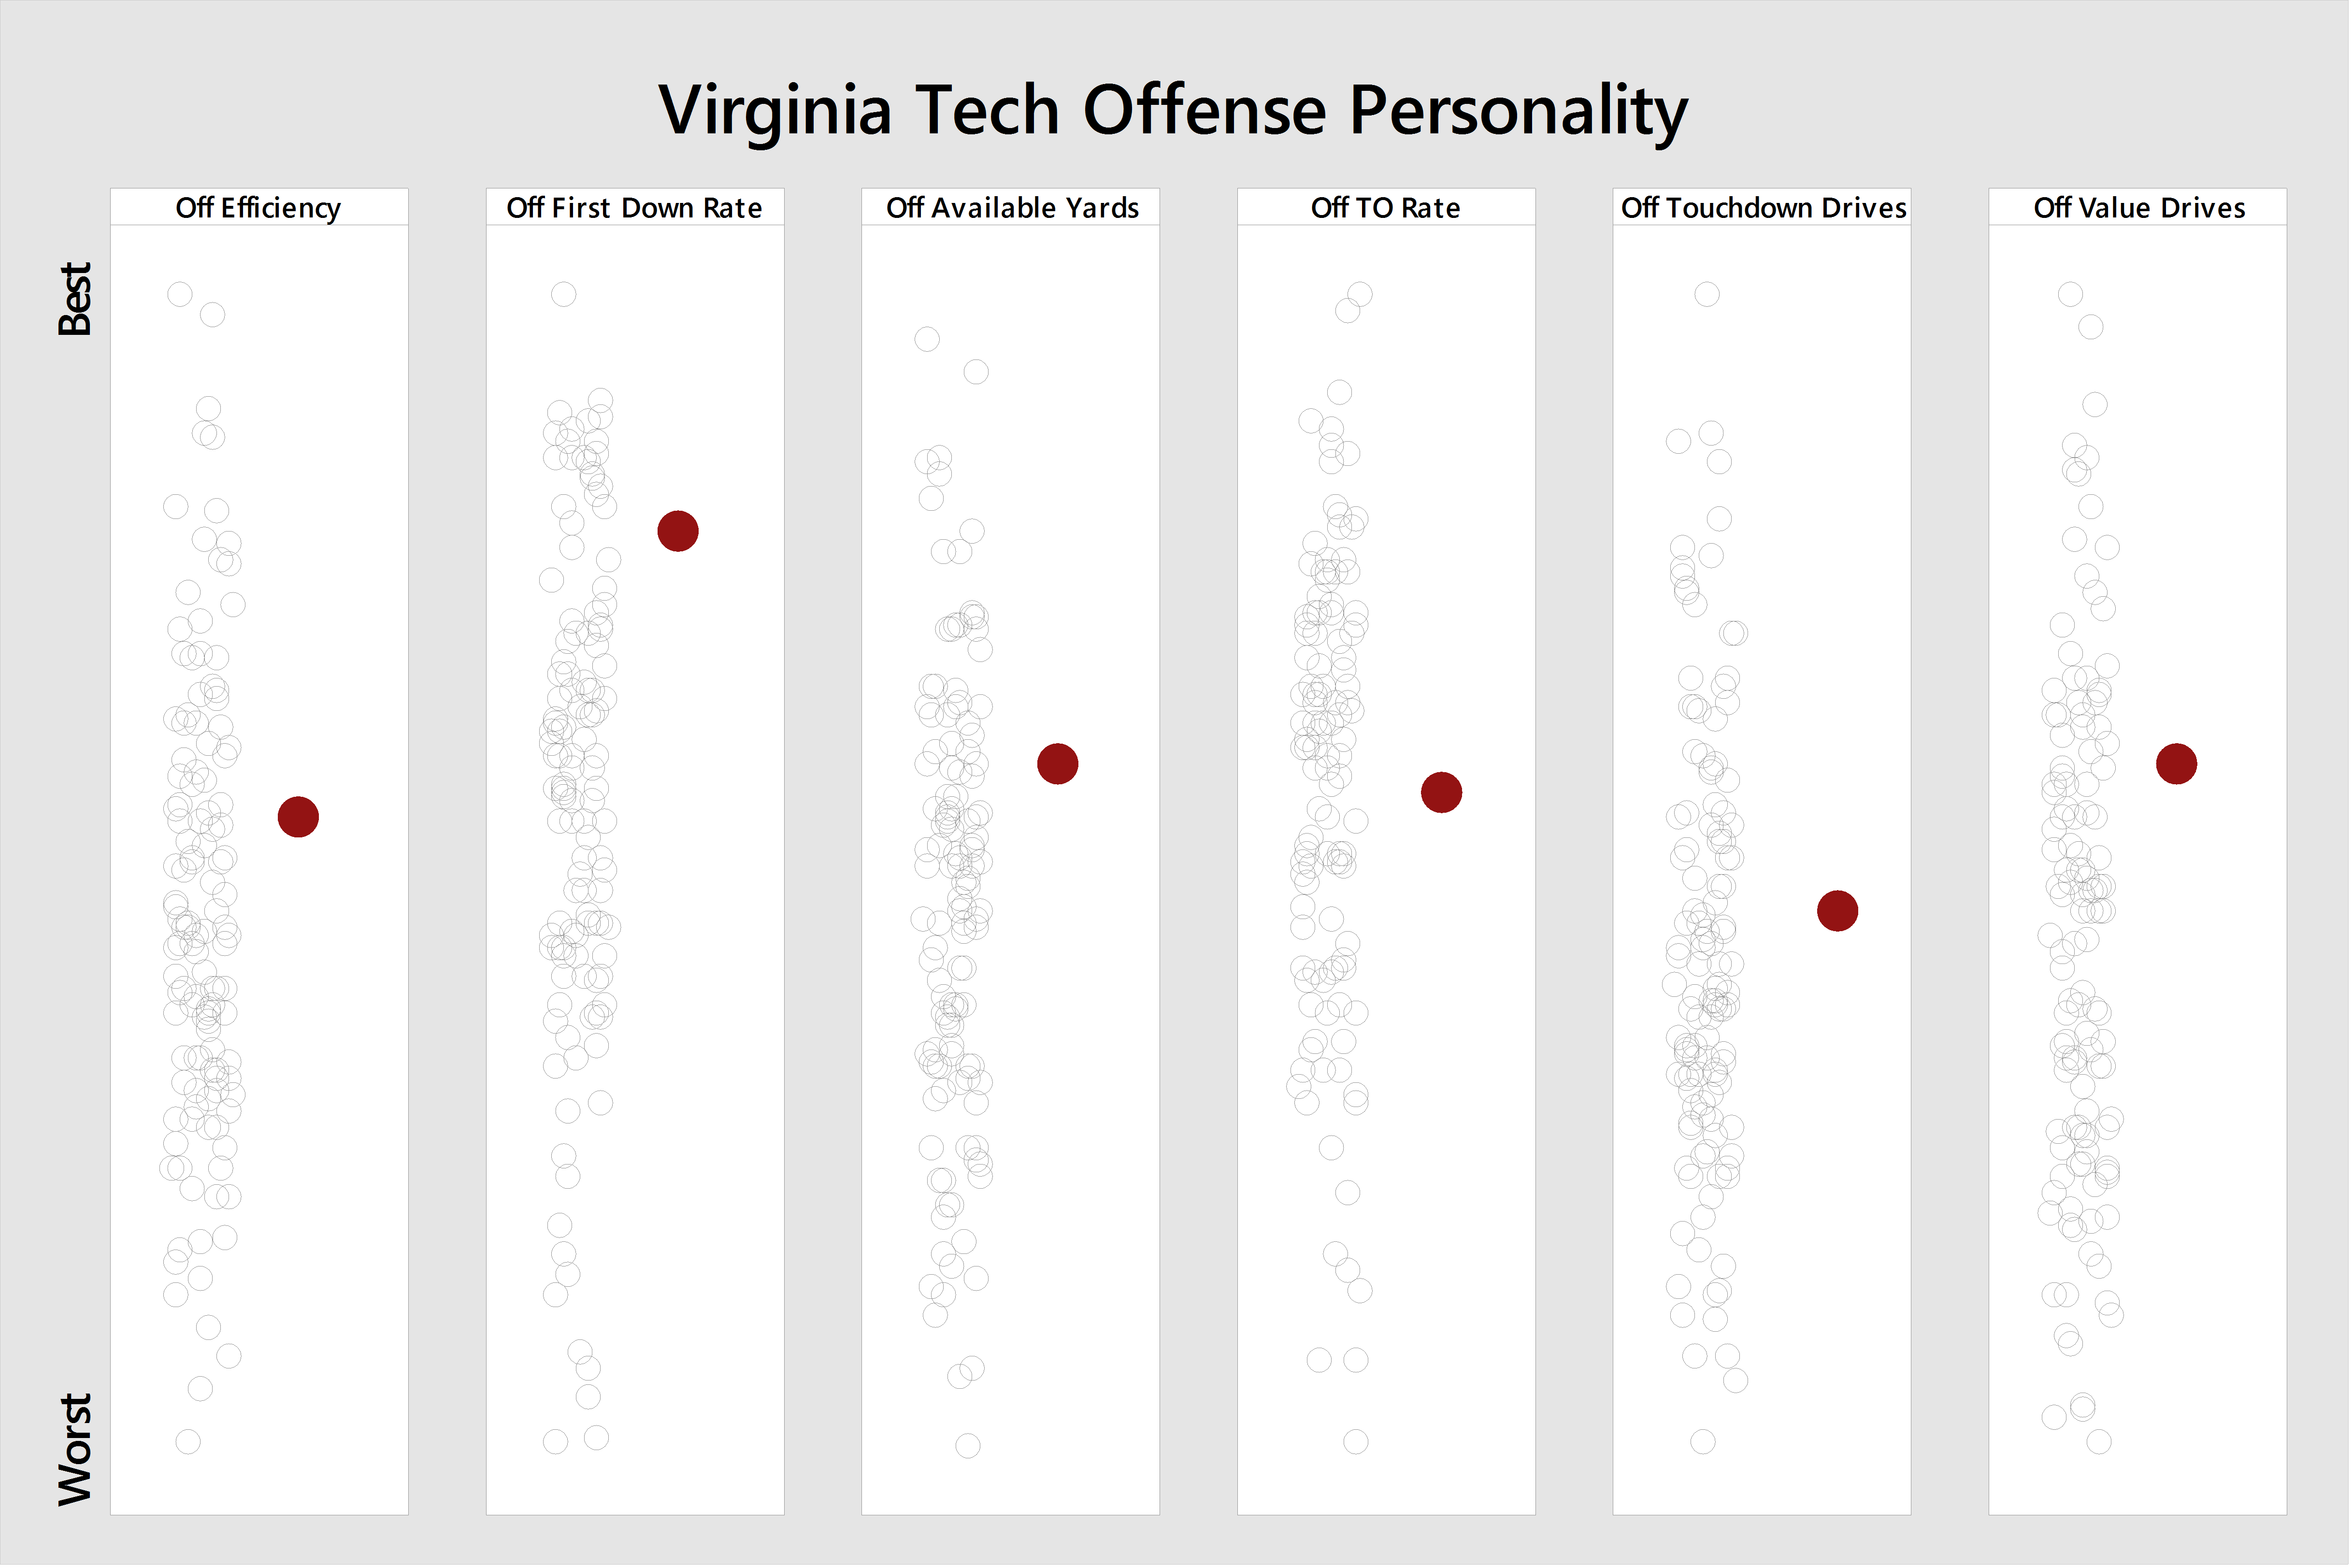
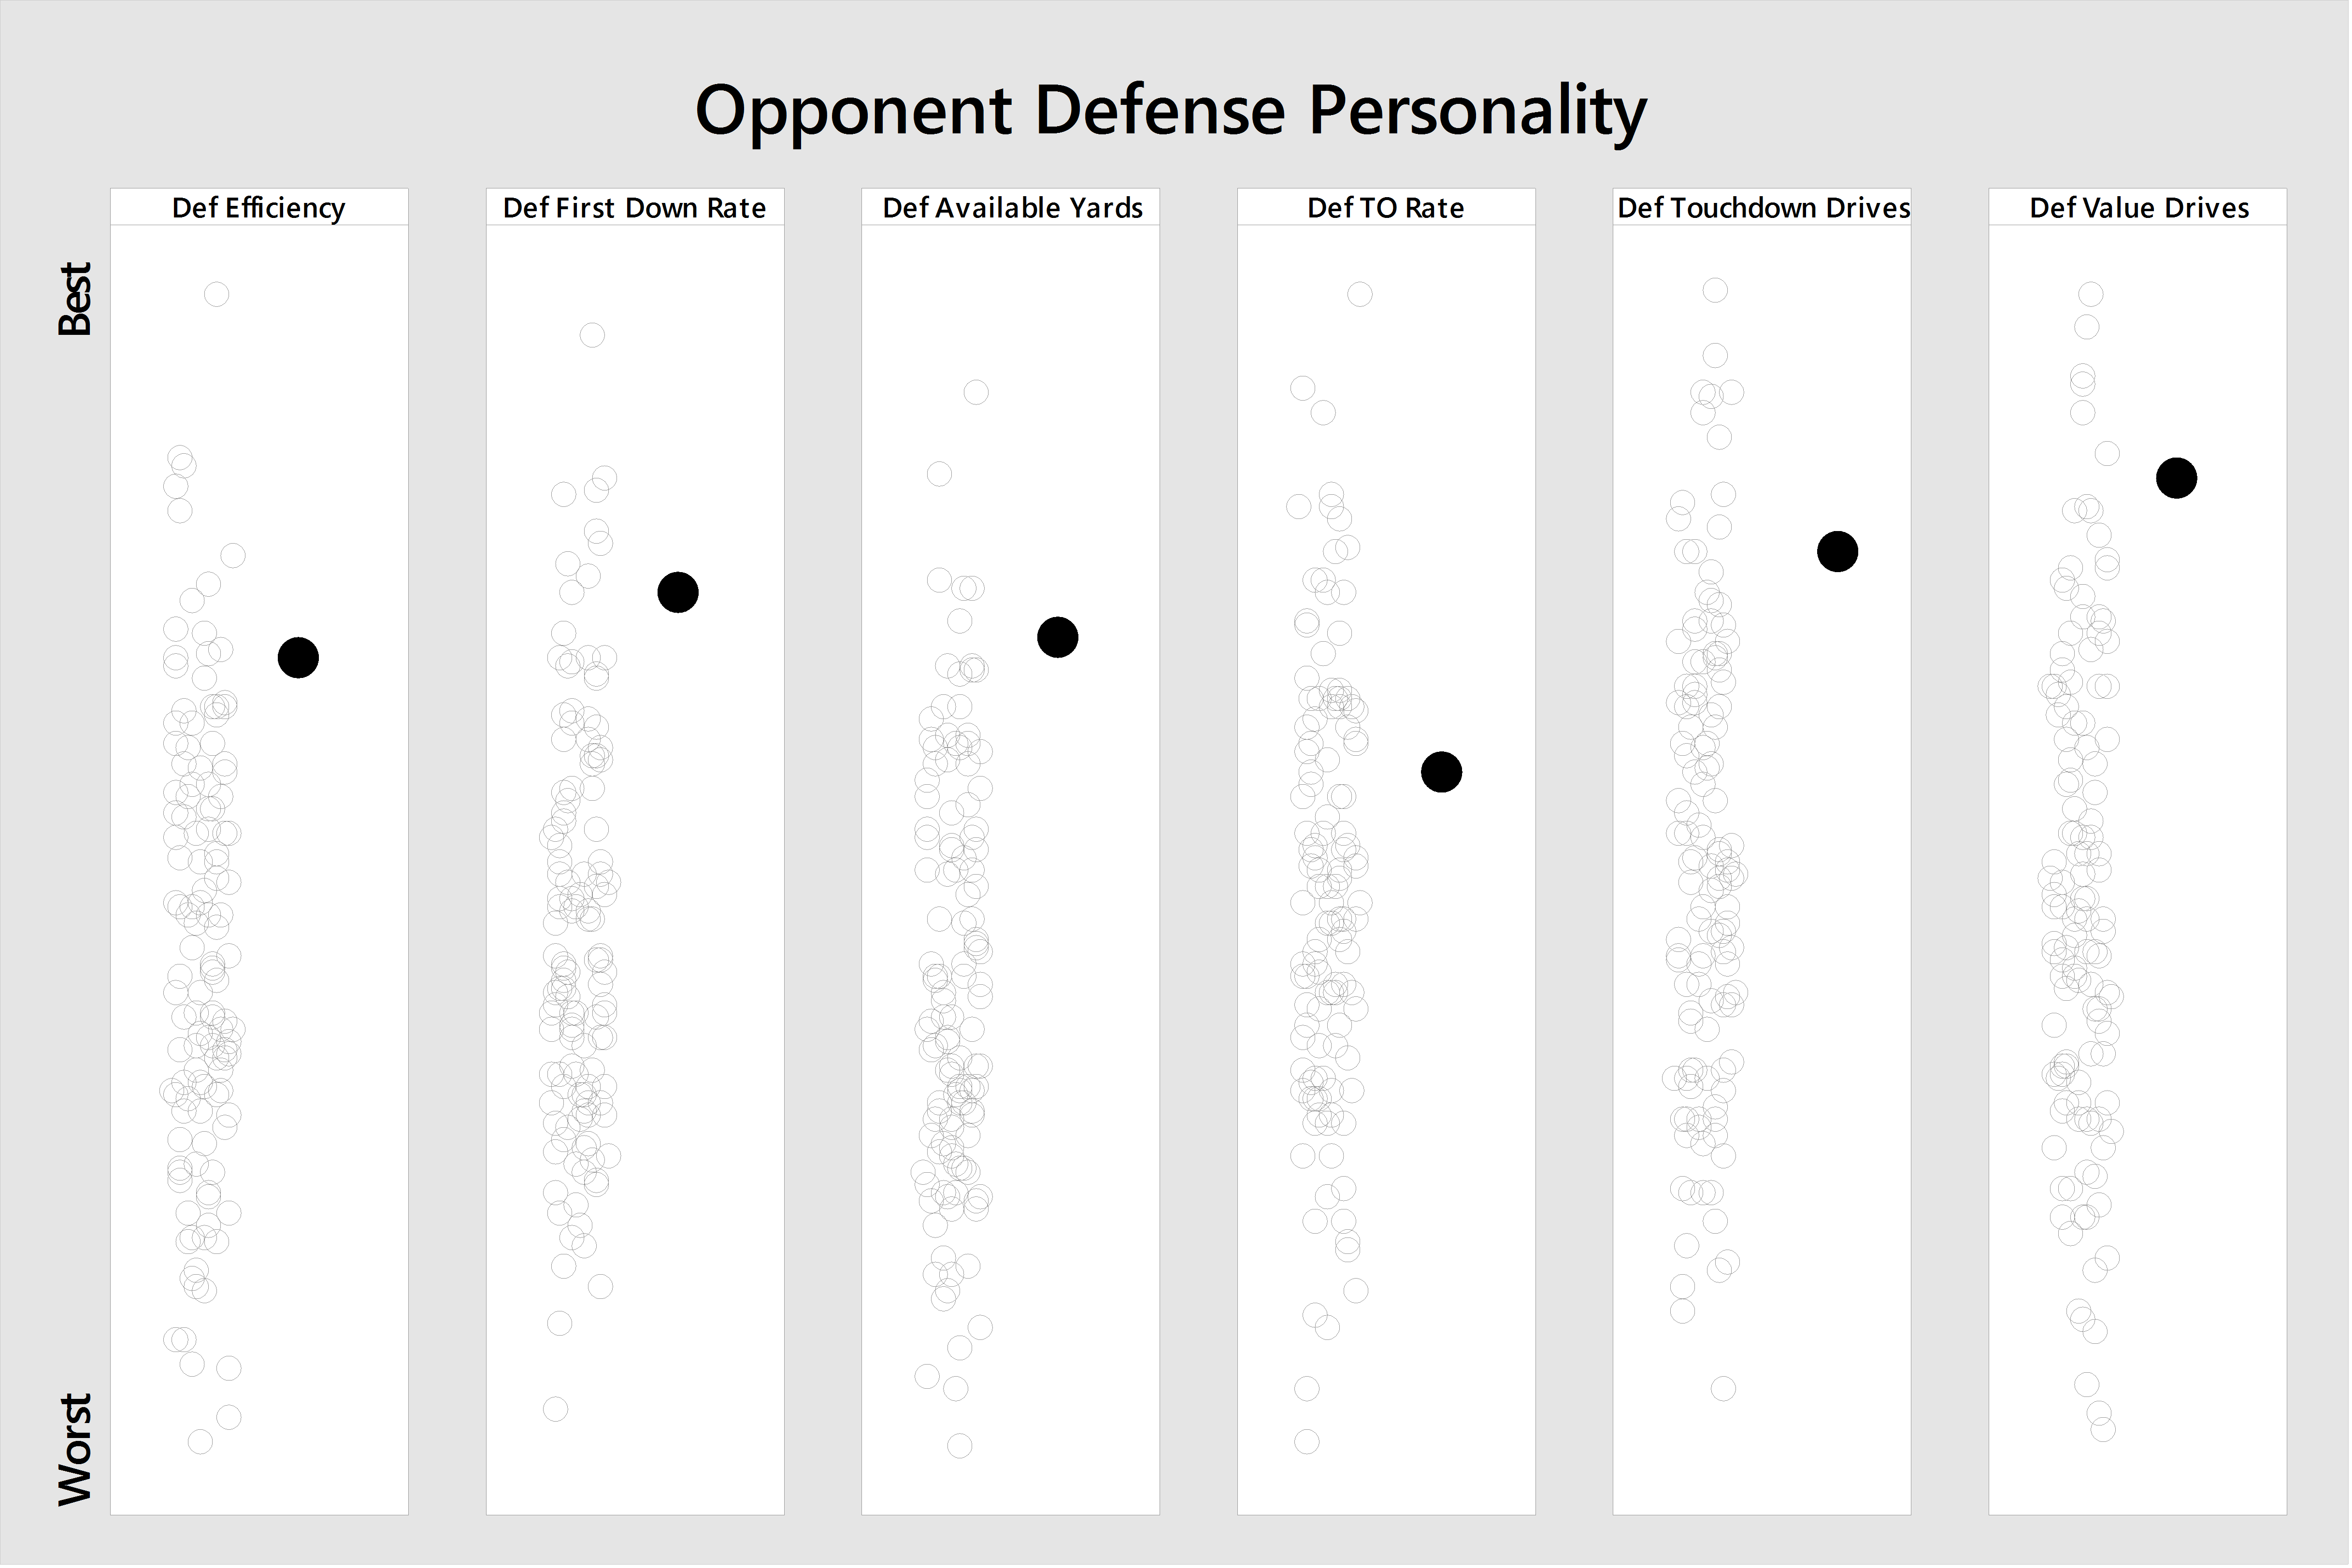
Across the board, Virginia Tech's offense is a decent team, but will be facing a defense that is great to elite.
The Virginia Tech offense is closest in personality to:
- Nevada
- Appalachian State
- Temple
The Clemson defense is closest in personality to:
- Louisville
- Troy
- Iowa
When Clemson Has the Ball
Again, examine pass-run comparisons first:
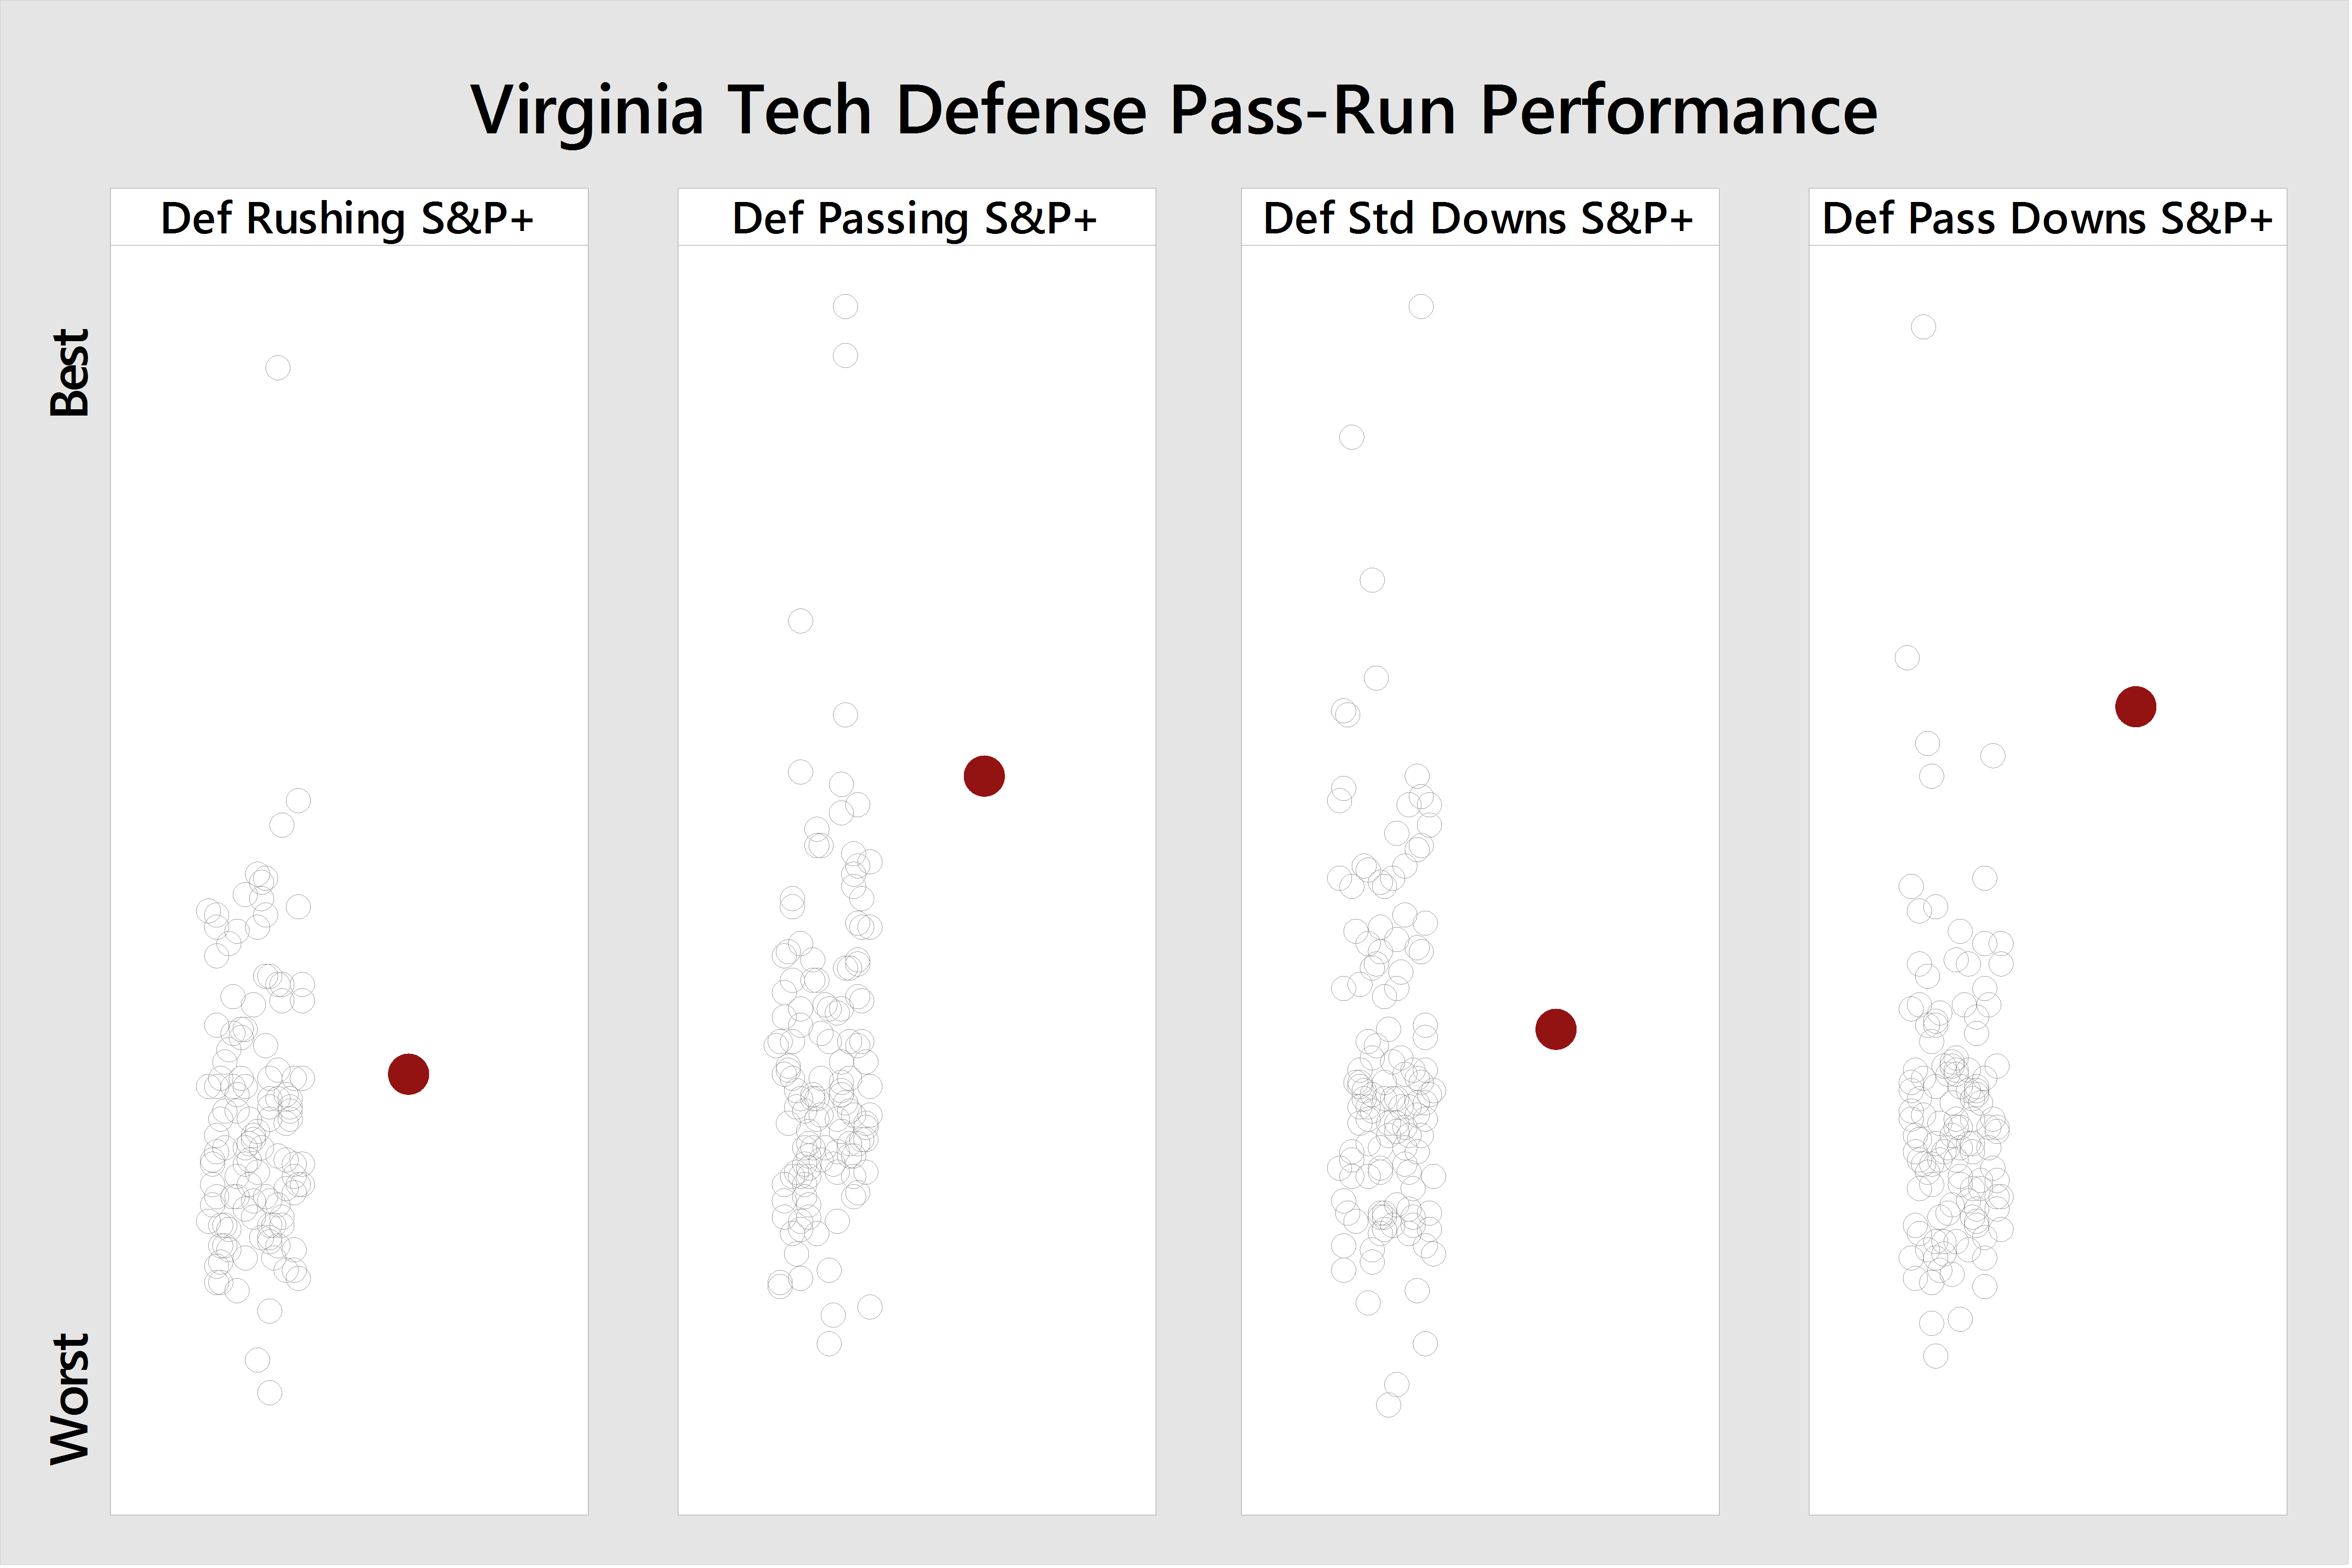
The Tigers present an excellent passing game and are especially dangerous on standard downs, but face a Hokies' defense that is also elite against the pass, but more effective on passing downs than standard downs.
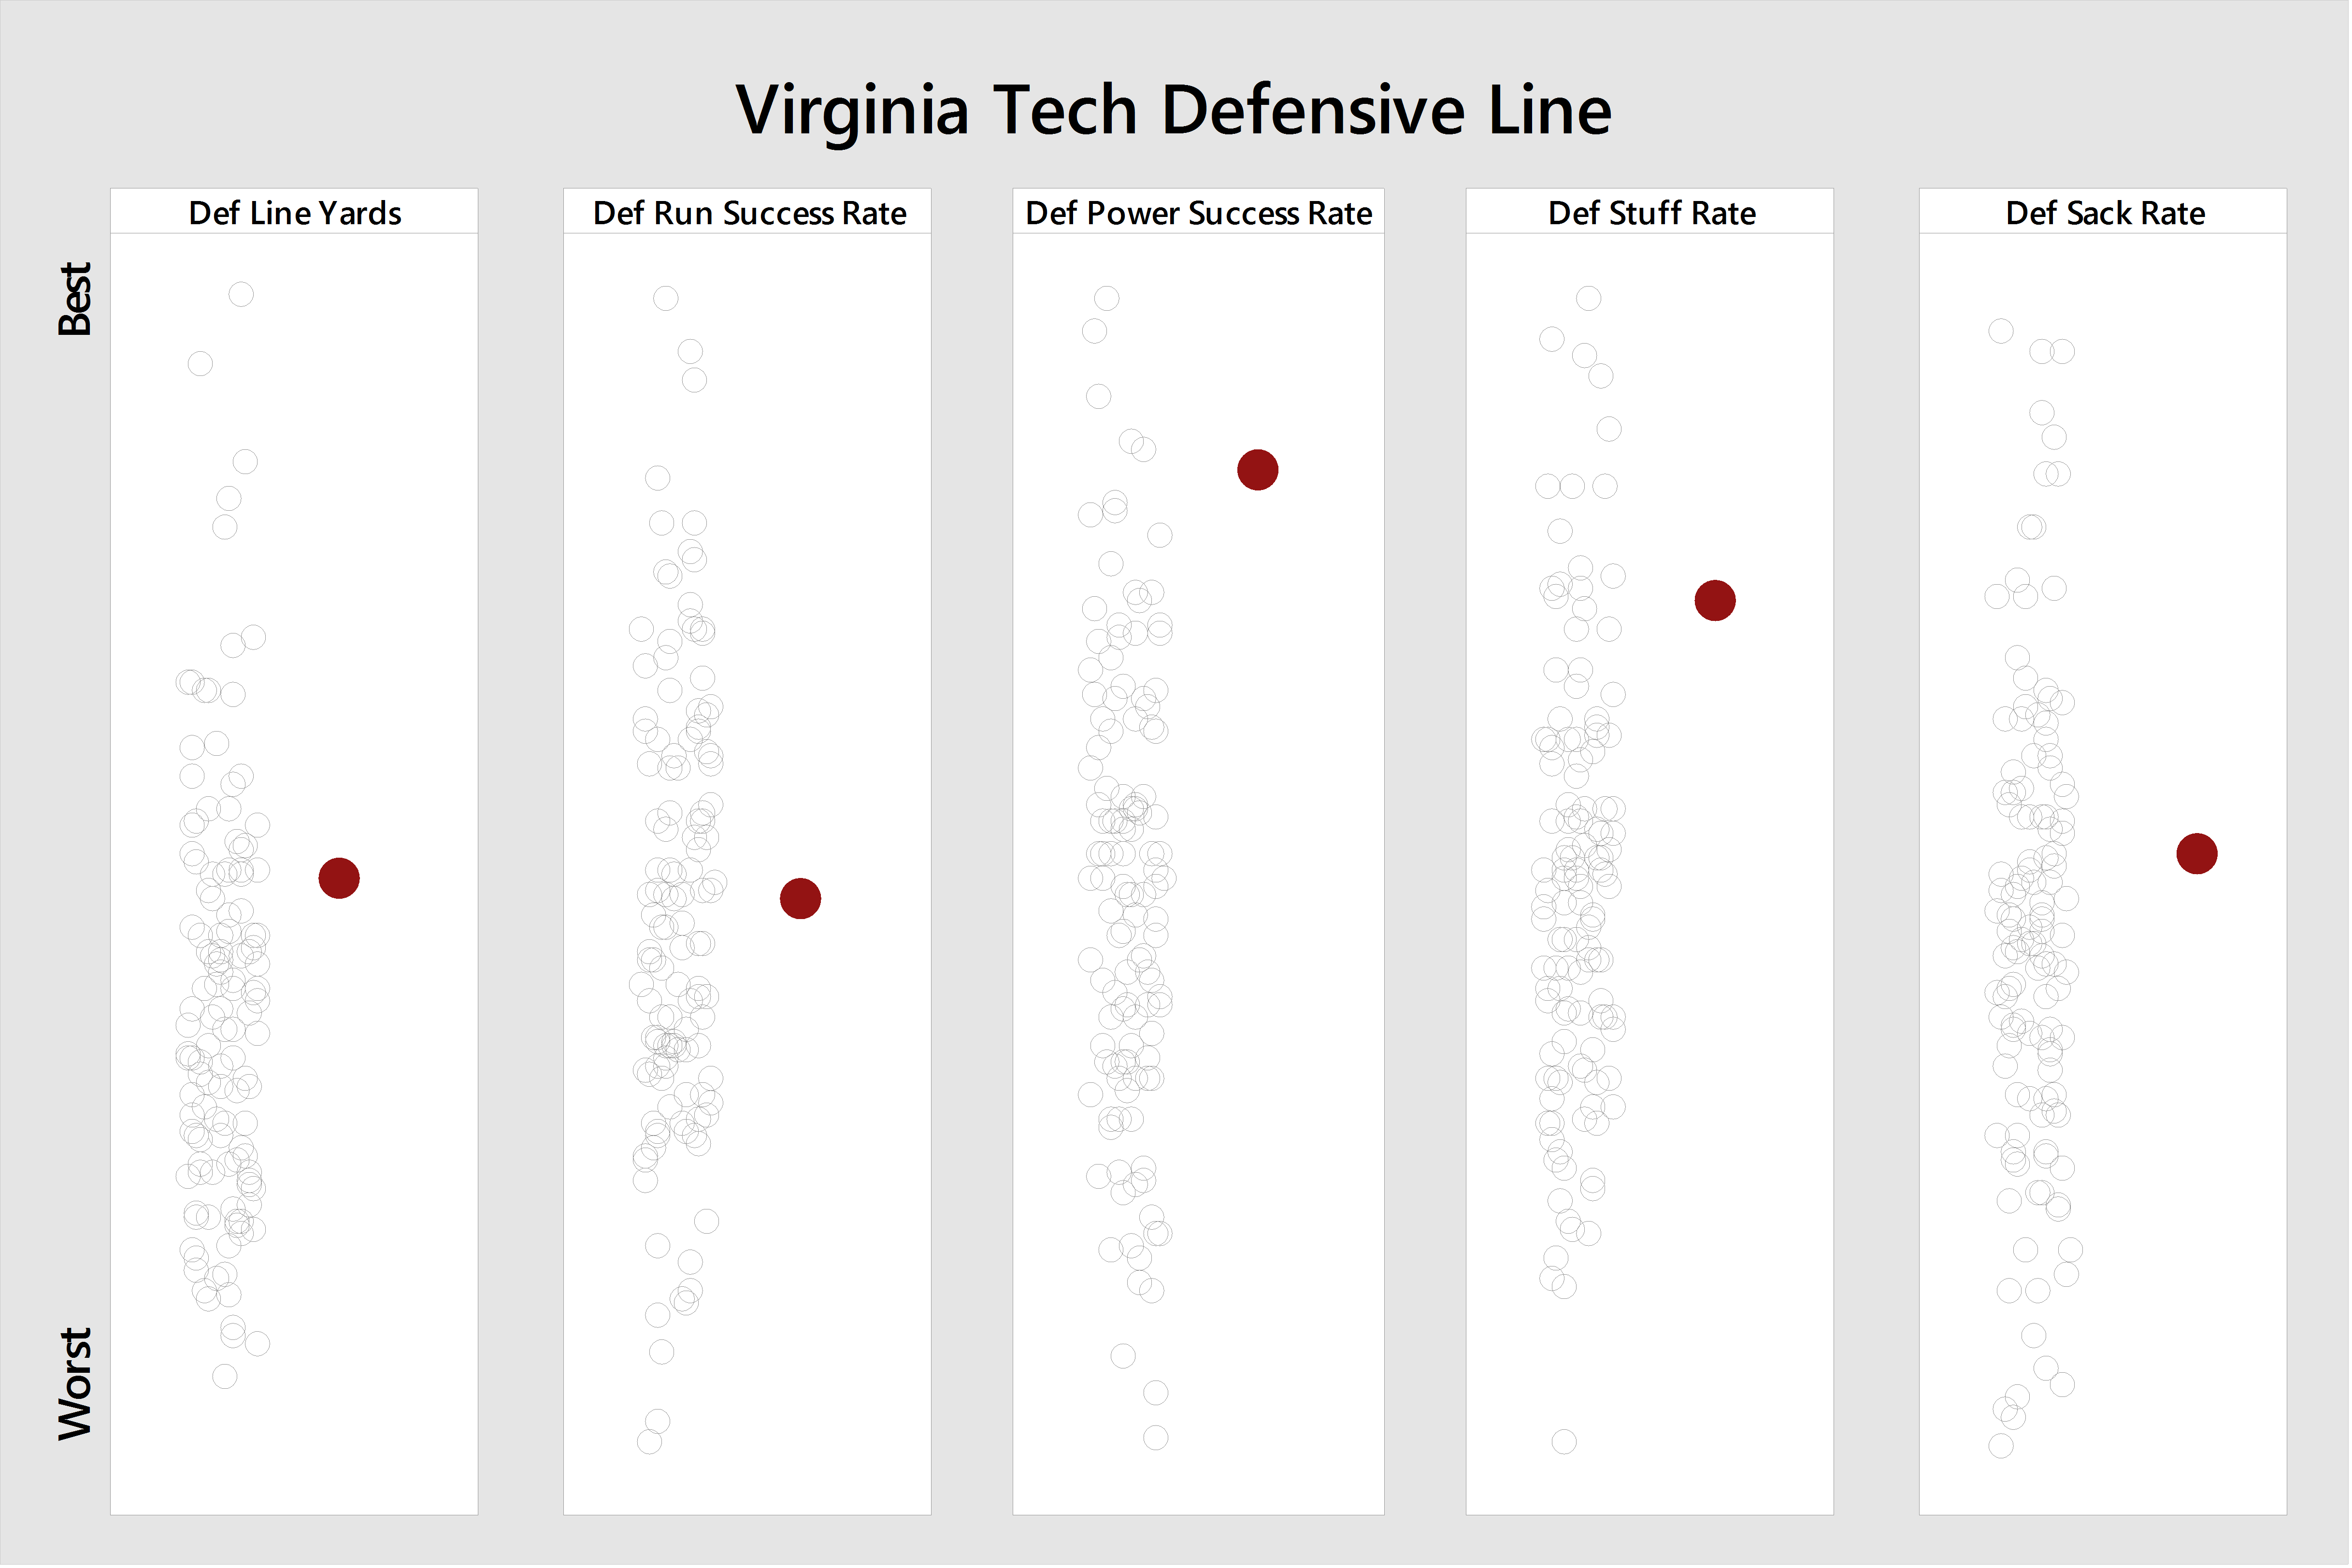
Offensive and defensive line performance are again compared using Football Outsiders' metrics:
As for personality traits:
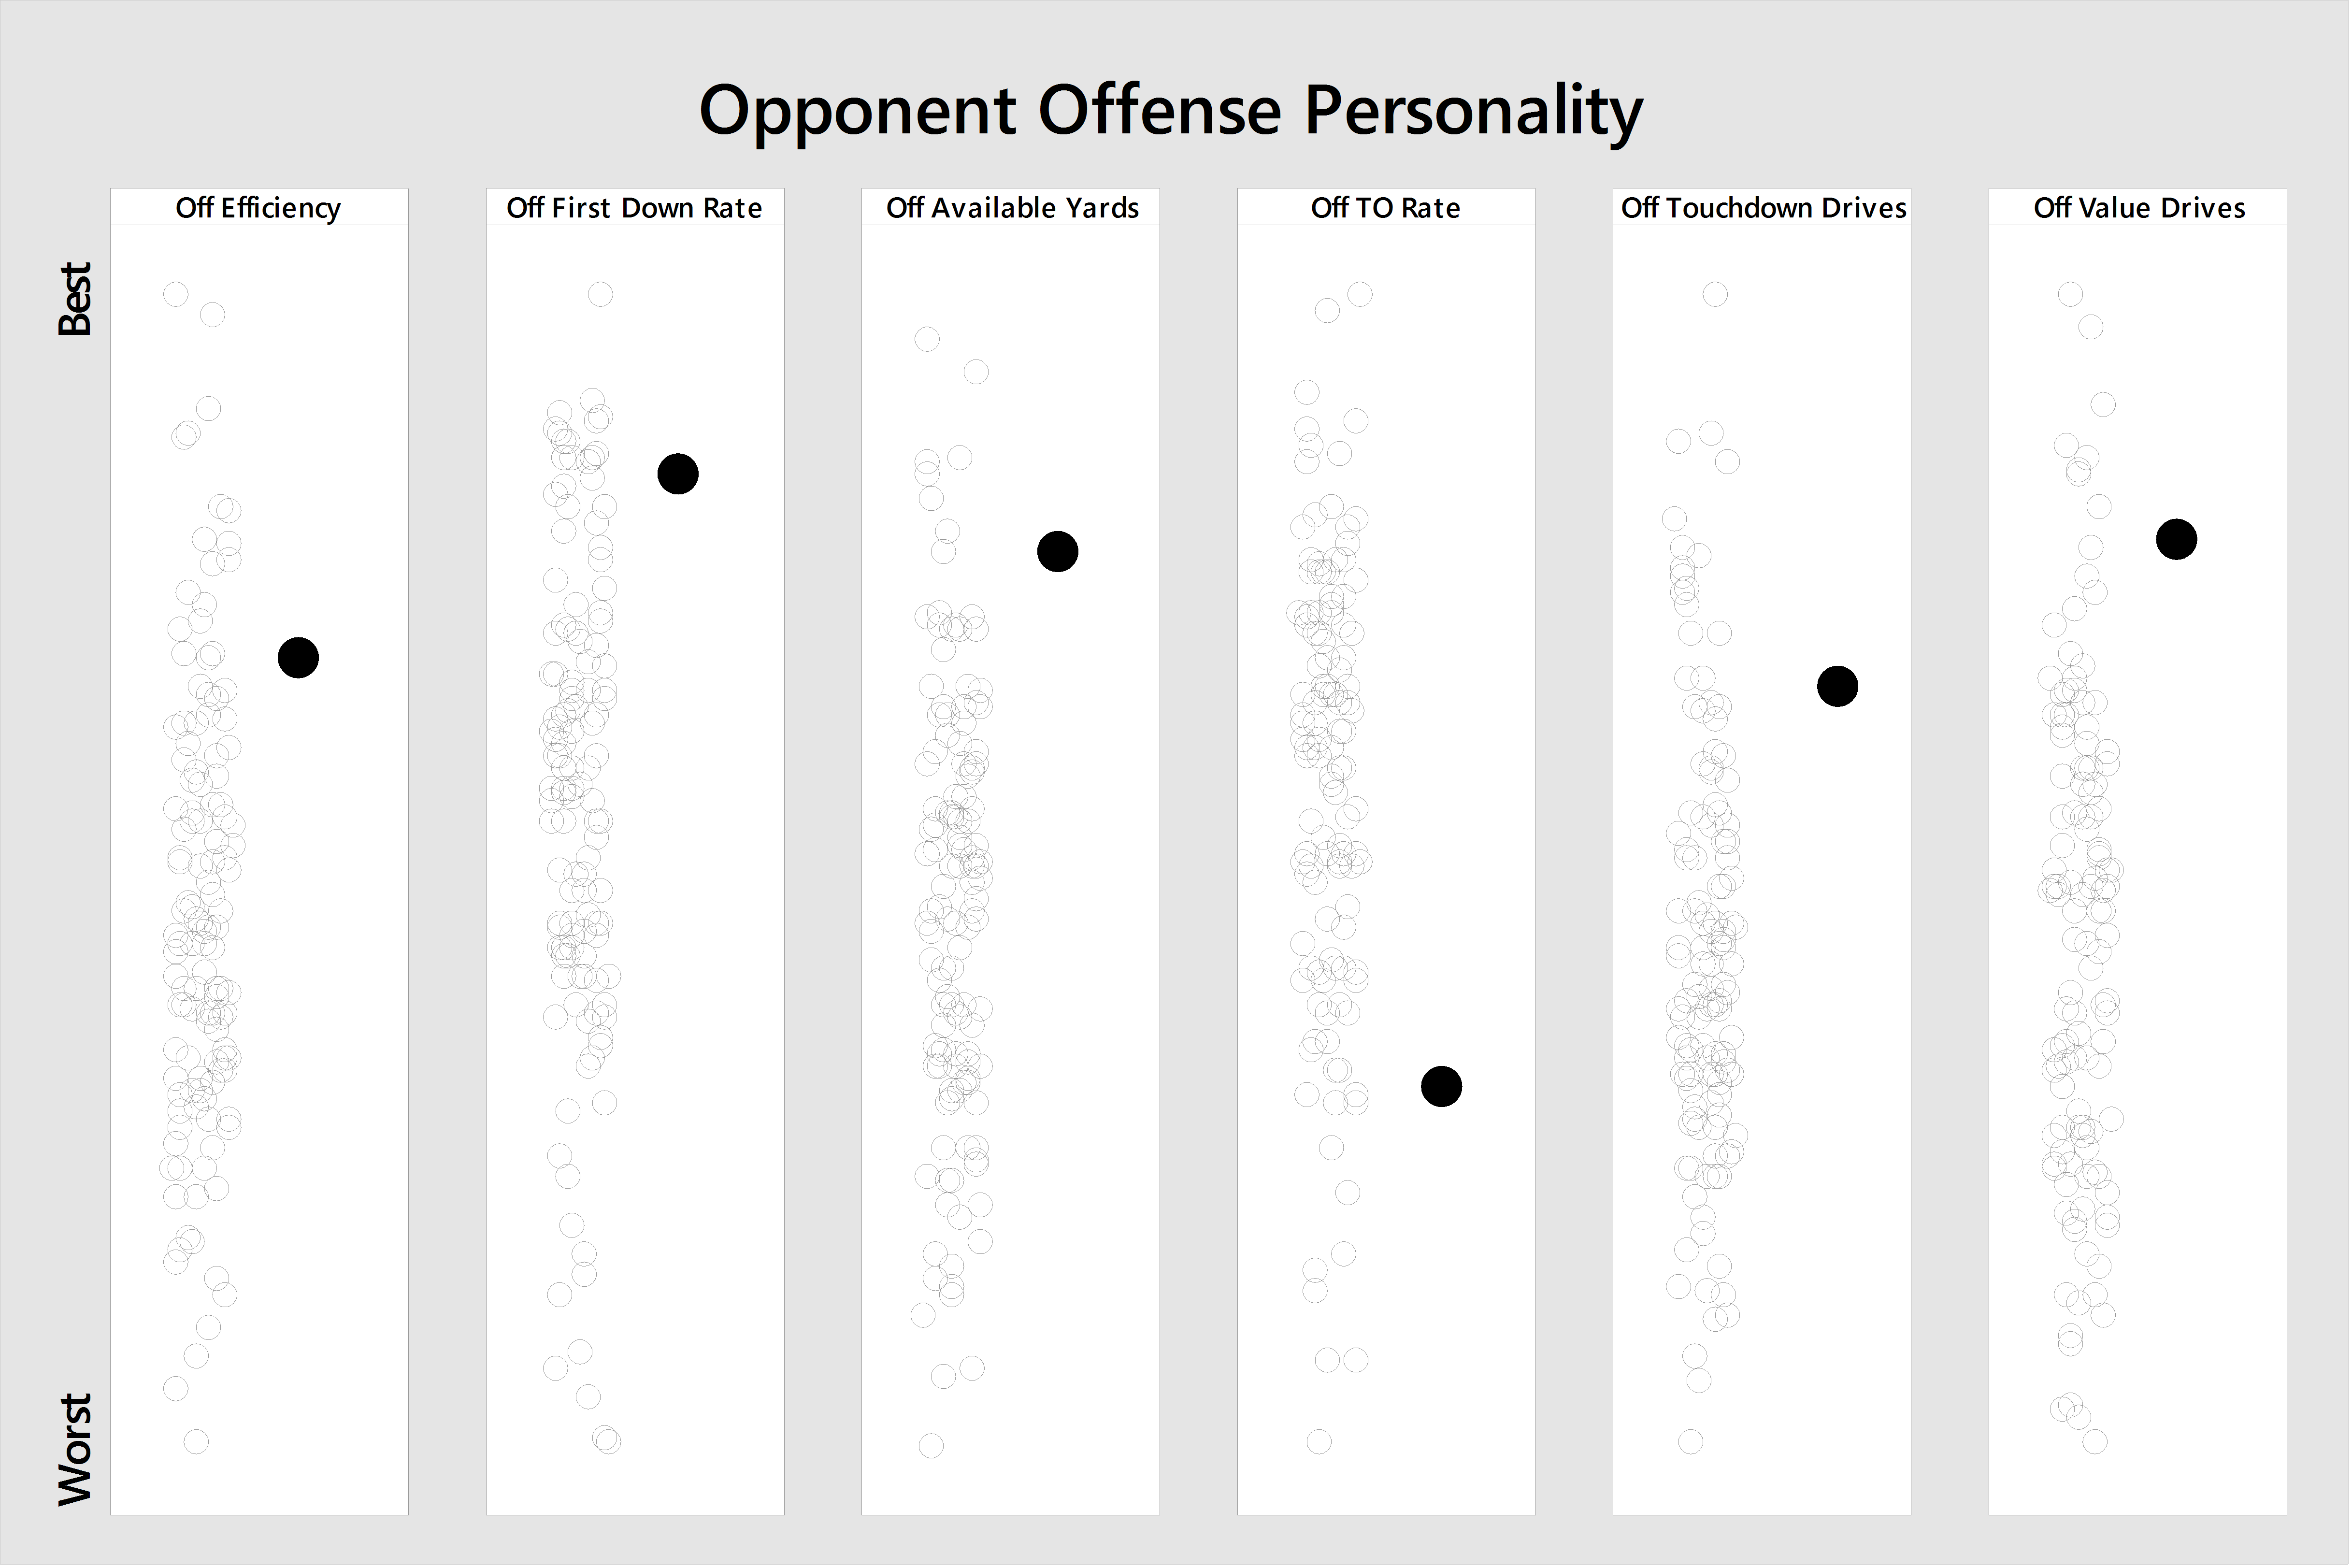
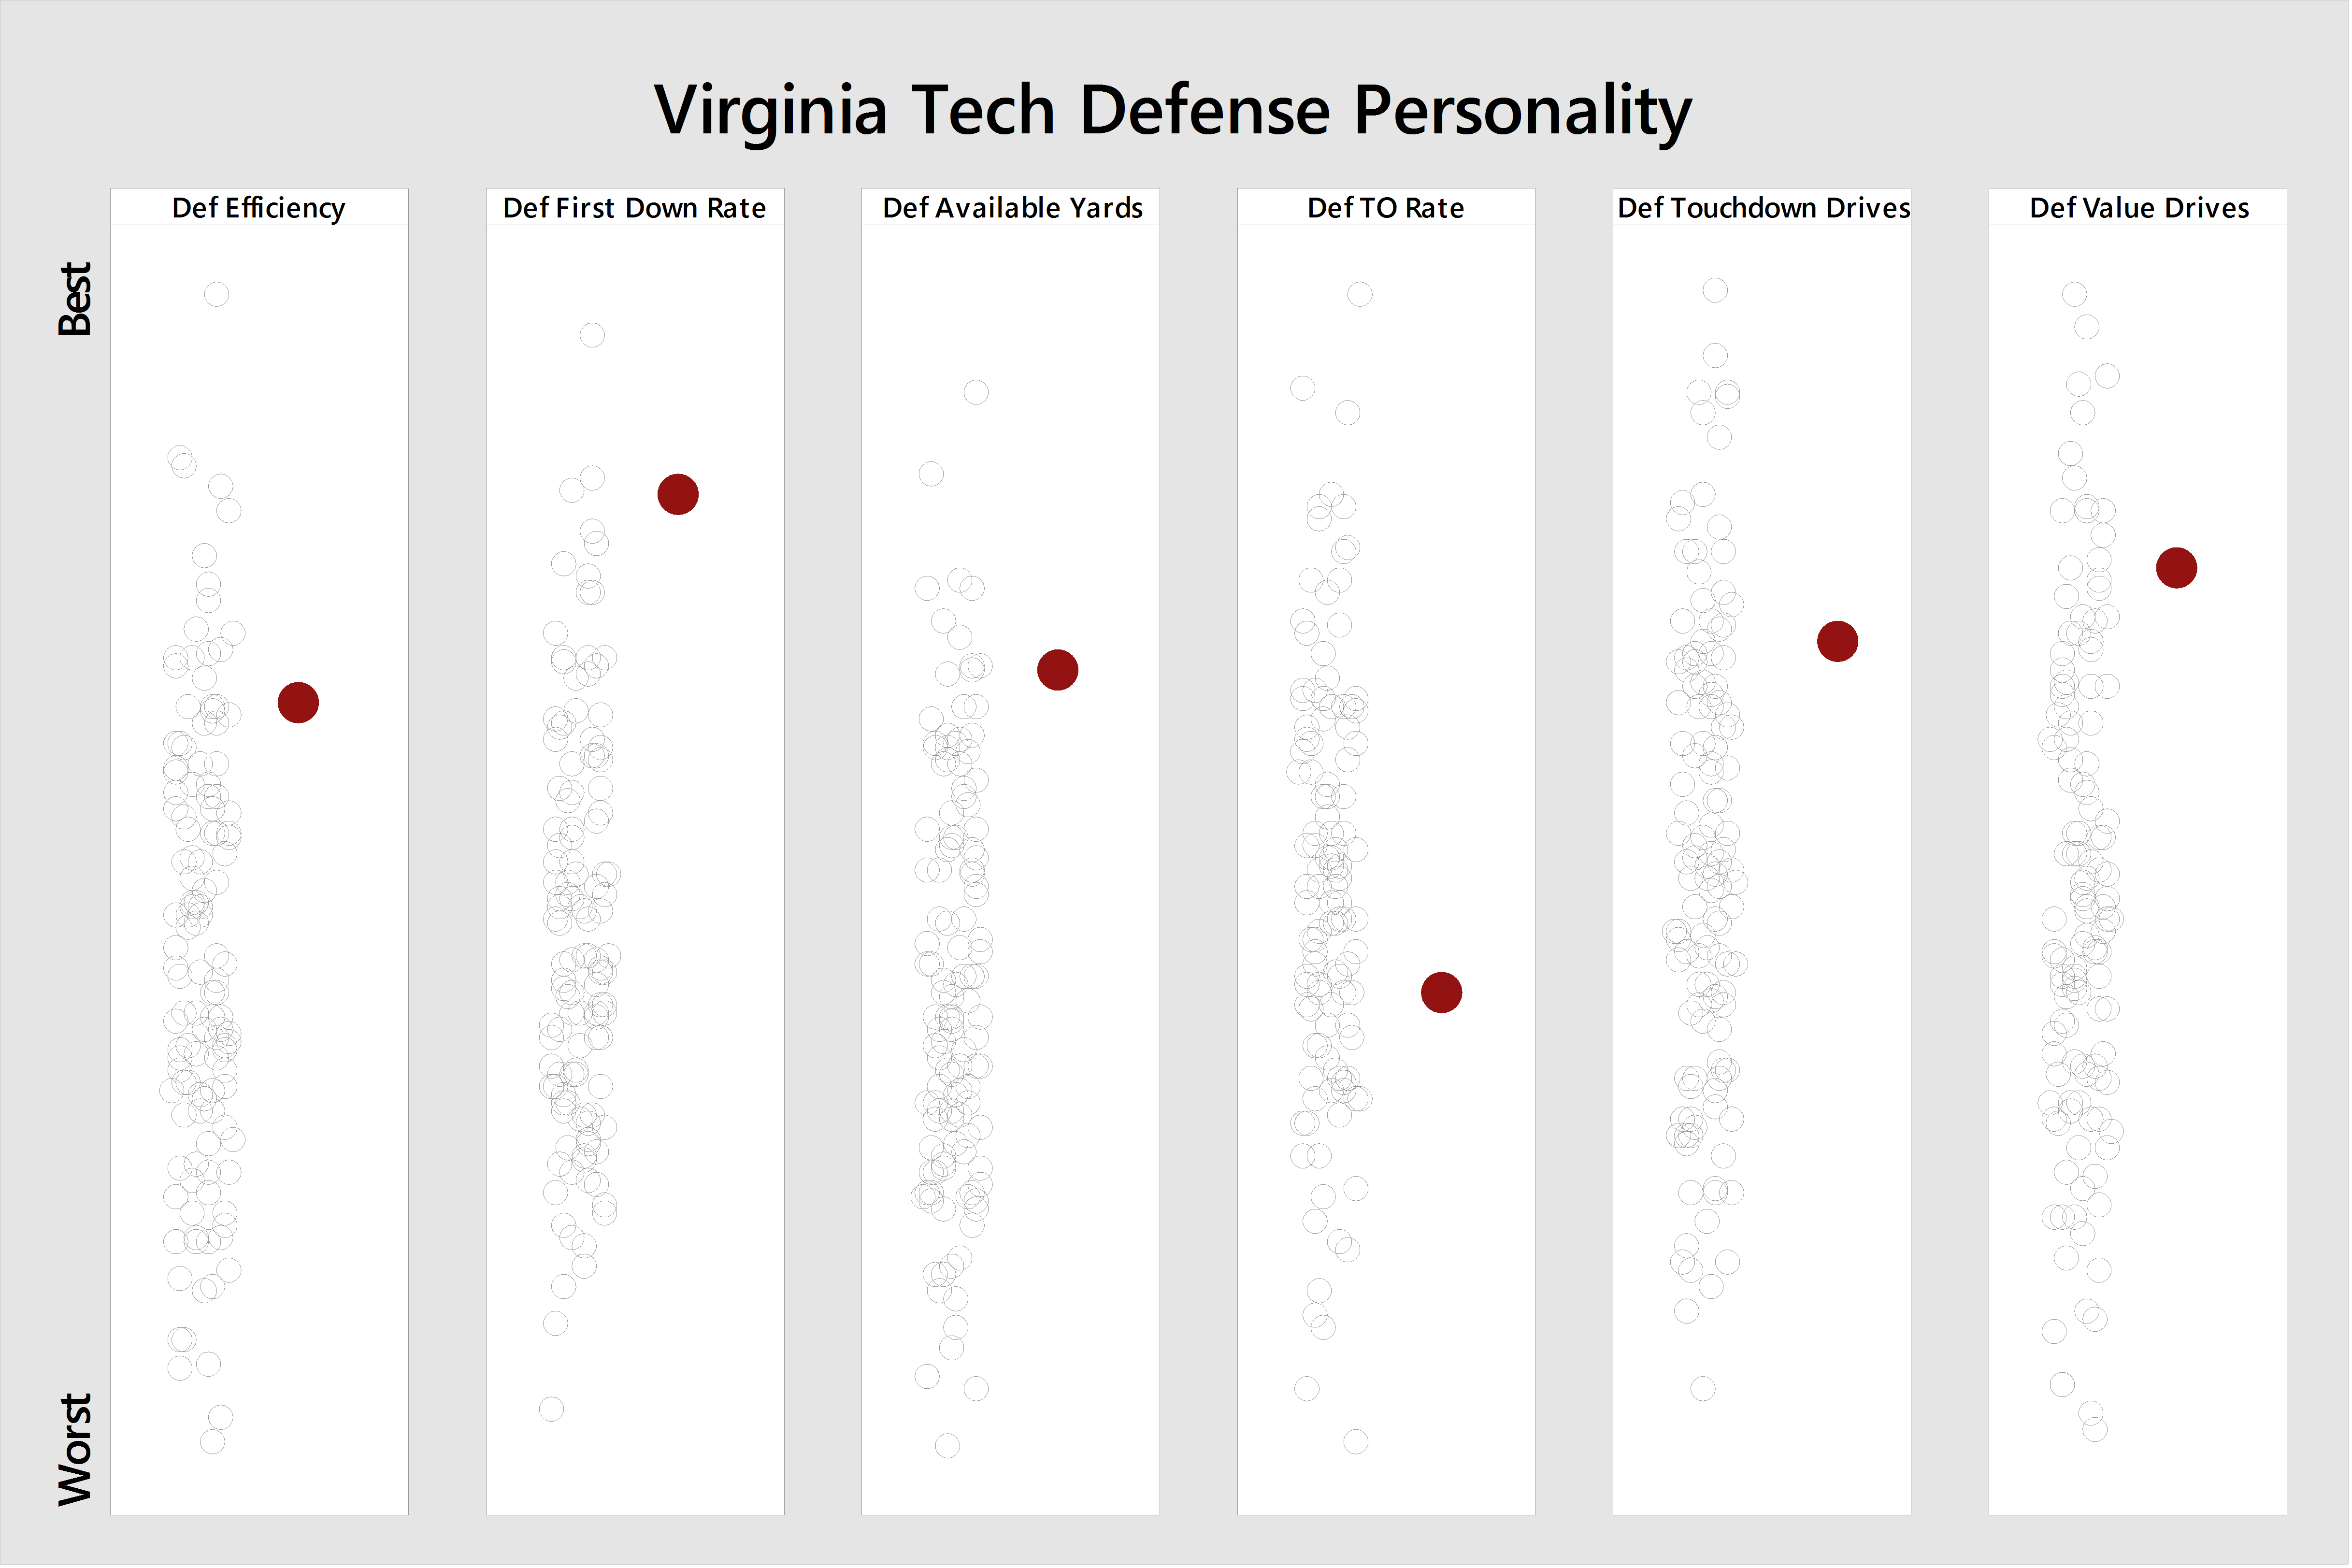
Clemson's major flaw on offense has been a propensity to turn the ball over, doing so 23 times this season (107th in the country). Unfortunately, Tech's defense has not been particularly effective at creating turnovers.
The Virginia Tech defense is closest in personality to:
- Temple
- Louisville
- Clemson
The Clemson offense is closest in personality to:
- Louisville
- Alabama
- USC
Special Teams
First we look at the Hokies' kicking units:
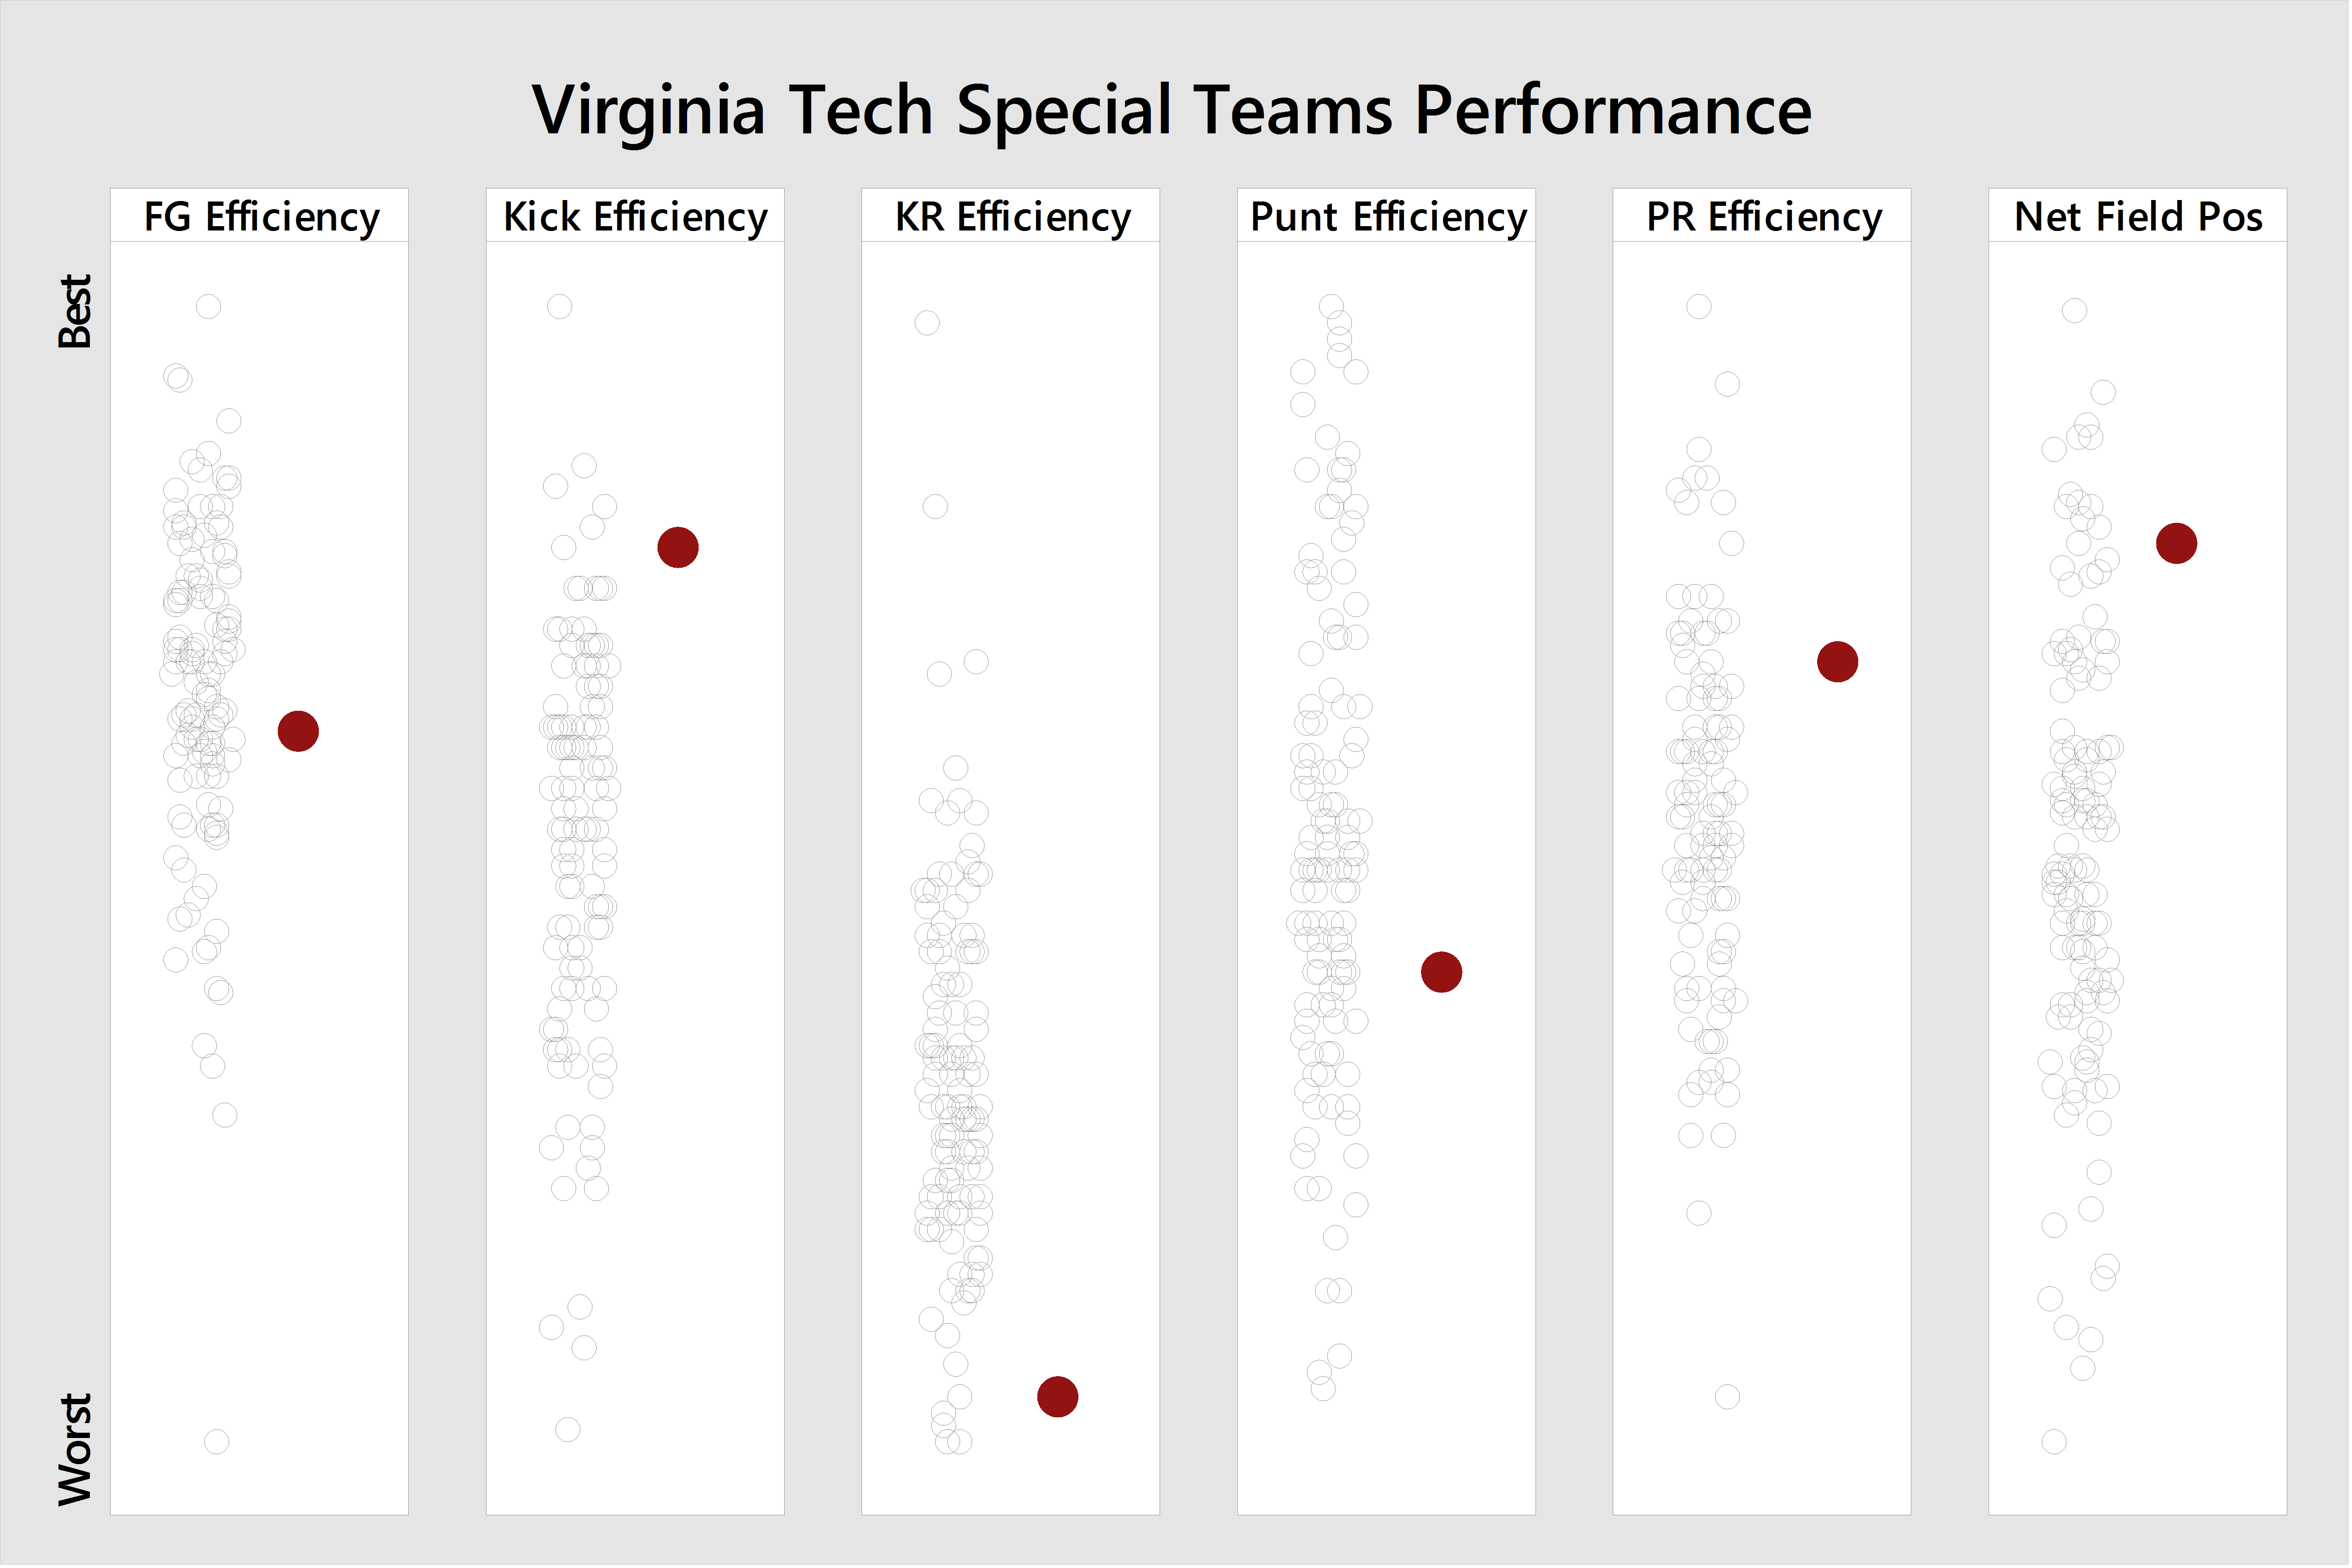
Virginia Tech could really use a more effective kick return unit.
When the Tigers kick:
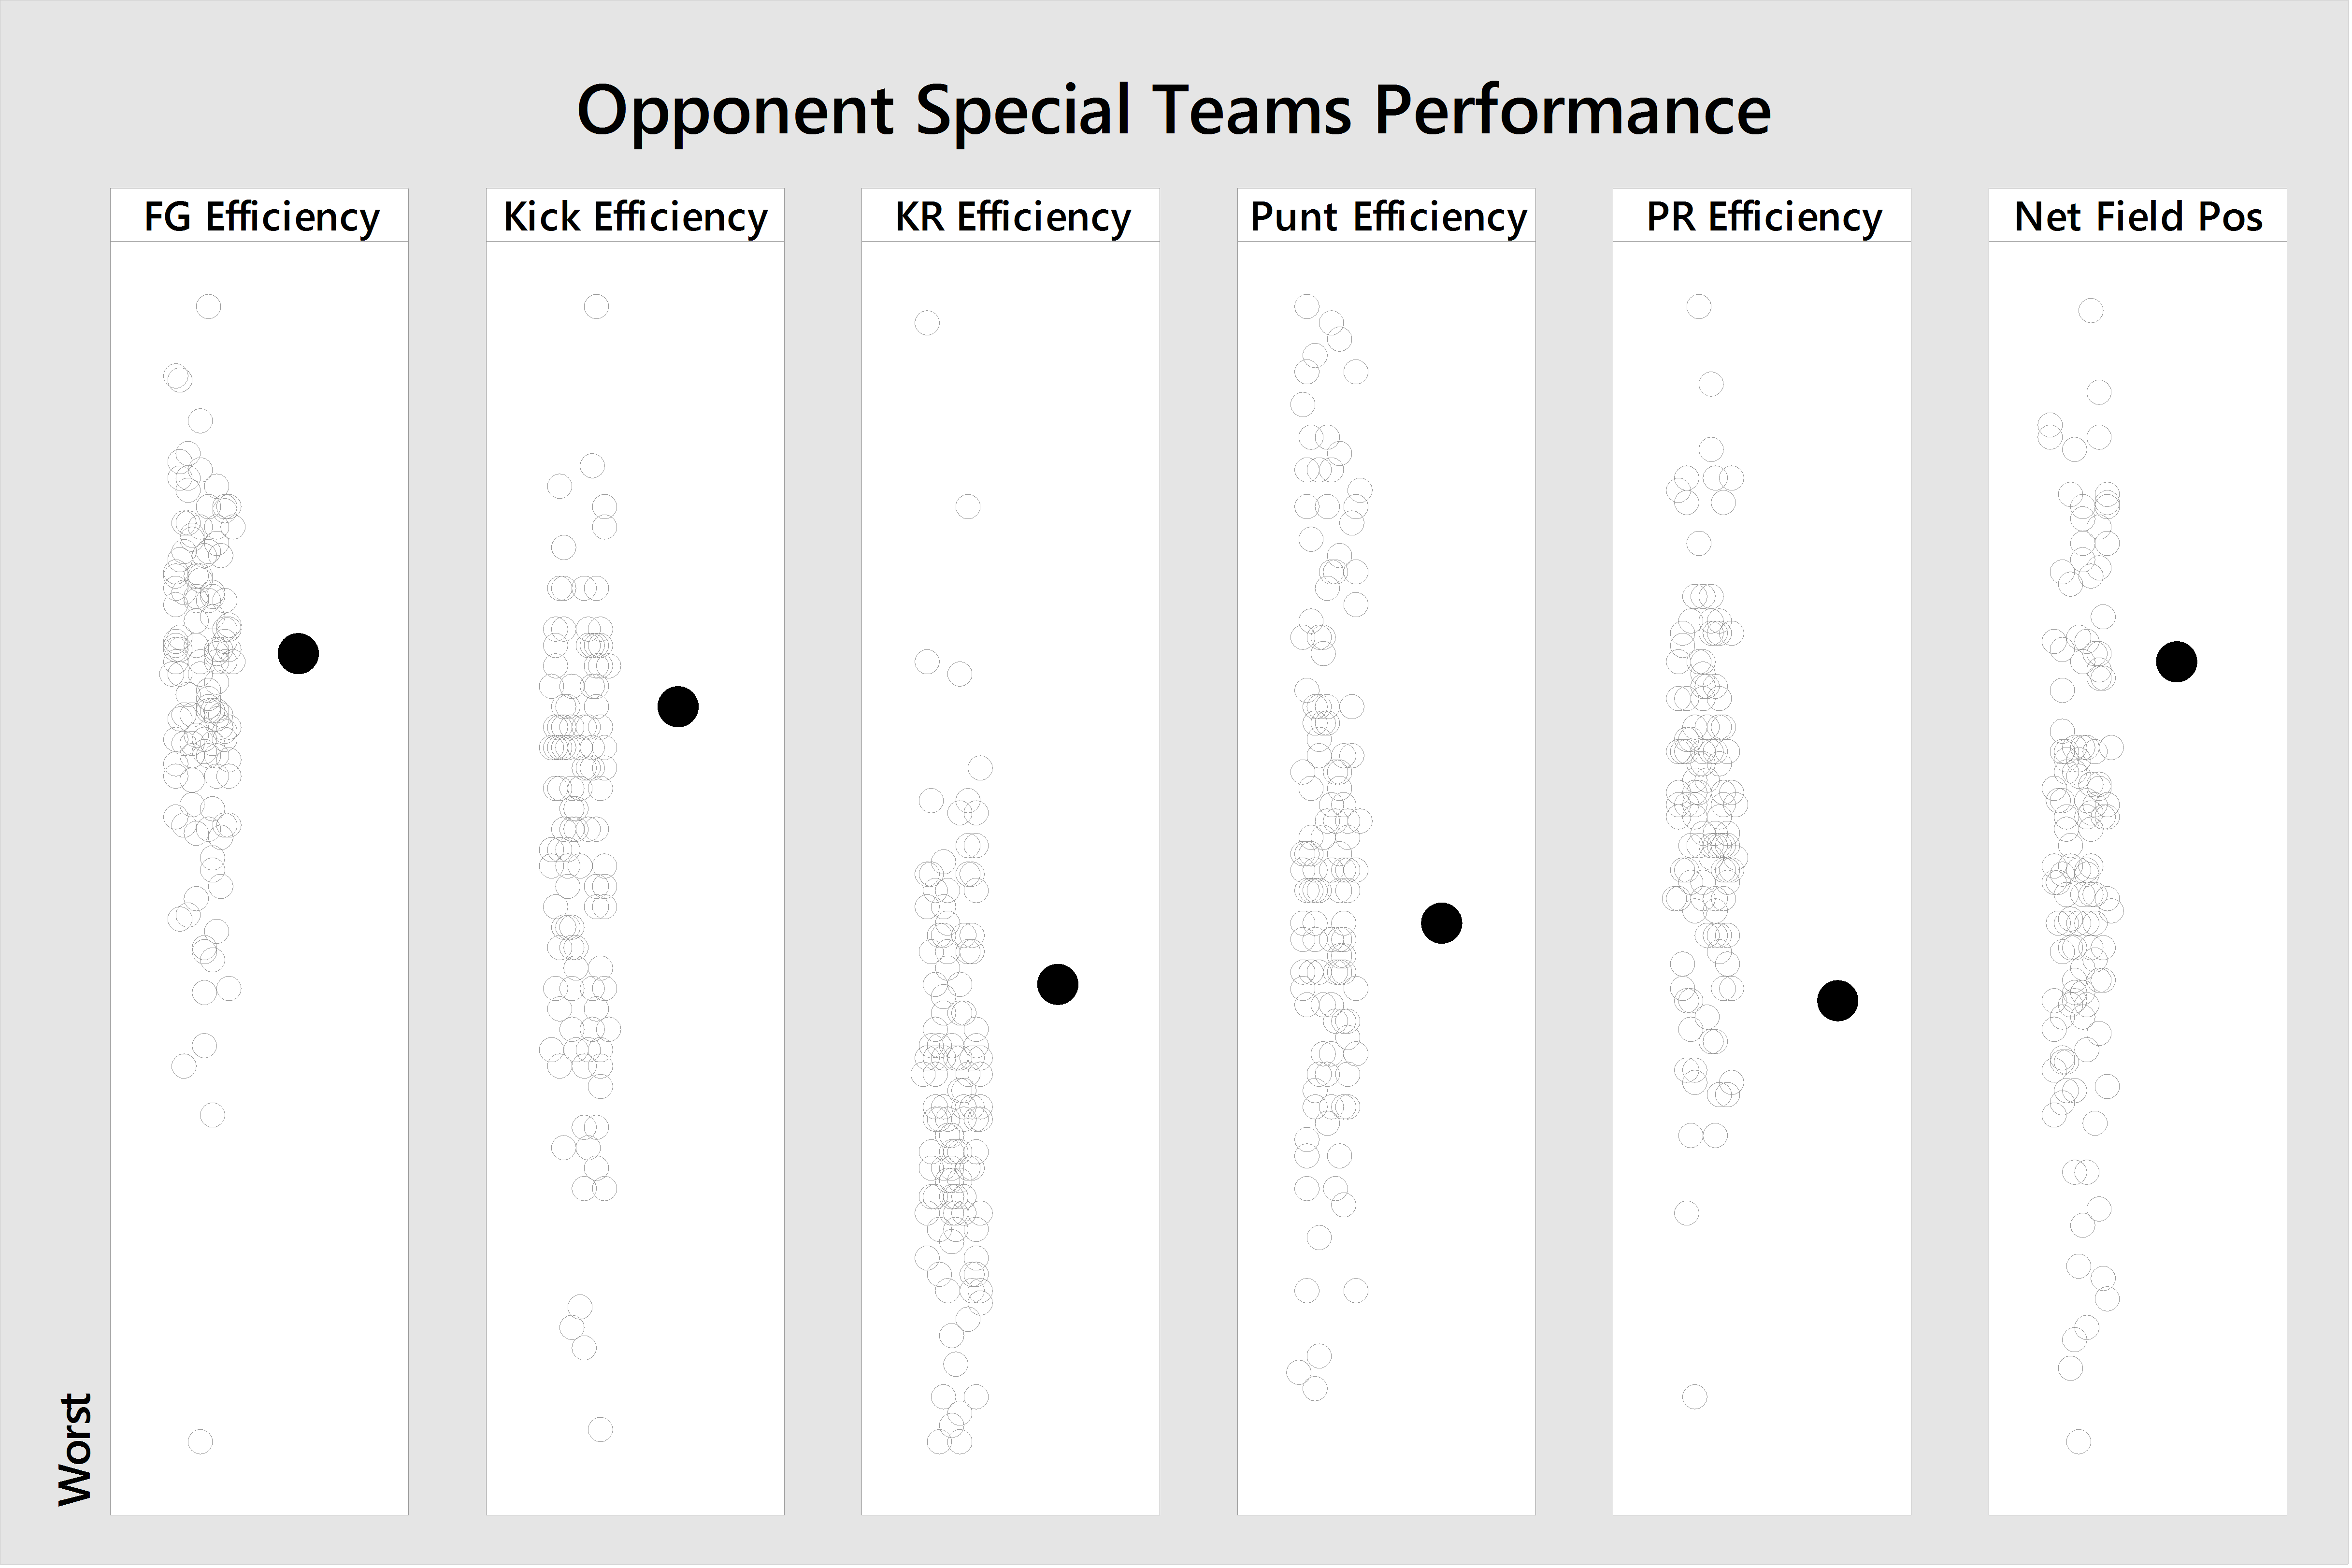
The strong kick return game should be shut down by Joey Slye.
Who To Watch Out For
Clemson is loaded with talent and the marquee names usually don't disappoint:
- QB Deshaun Watson may have dropped off the Heisman radar this season, but is still a dangerous passer — and runner — and ranks among the ACC's top four in passer rating. Of course his counterpart has a higher QB rating, and by extrapolation if Jerod Evans attempted as many passes would lead him by 270 yards with 8 fewer interceptions and one less touchdown. Also, Evans has already rushed for 269 more yards and scors. But hey, Deshaun will still be one of the best two QBs in the ACC Championship game!
- WR Mike Williams is the Clemson's leading receiver. He's caught 10 TD's, averages 10 yards per target, and 14.1 yards per catch.
- KR Artavis Scott is a middle-of-the-pack returner, but who cares since Joey Slye is 5th in the country in average kickoff distance (just .32 yards shy of first) and 3rd in touchback percentage (76.54%).
Statistical Key to the Game
I see two areas of opportunity for the Hokies. The first is to force Clemson into passing downs and not allow them to have third- or fourth-and-short situations that they are likely to convert. Clemson has not been particularly explosive this season, but is very efficient.
The second is to create turnovers — Watson has thrown 14 interceptions already this season, and the Hokies' defense needs to take advantage of any passing mistakes.
The Stats that Define Virginia Tech's Season
Revisiting my column from this summer on the stats that will define the season, here is how the Hokies performed thus far (each listed as VT - Opponent):
| Opponent | PPP | Pace (sec/play) | ToP |
|---|---|---|---|
| Liberty | .40 - .21 | 22.7 - 25.5 | 33:42 - 26:18 |
| Tennessee | .33 - .71 | 26.1 - 26.1 | 31:44 - 28:16 |
| Boston College | .64 - 0 | 27.5 - 26.1 | 35:15 - 24:45 |
| East Carolina | .79 - .25 | 26.5 - 26.0 | 30:03 - 29:57 |
| UNC | .41 - .05 | 28.9 - 19.4 | 39:59 - 20:01 |
| Syracuse | .24 - .31 | 22.2 - 20.1 | 26:35 - 33:25 |
| Miami | .55 - .21 | 26.4 - 23.5 | 29:28 - 30:32 |
| Pitt | .48 - .65 | 24.4 - 29.1 | 33:17 - 26:43 |
| Duke | .30 - .28 | 22.8- 23.1 | 30:02 - 29:58 |
| Georgia Tech | .25 - .46 | 26.9 - 22.2 | 24:05 - 35:55 |
| Notre Dame | .33 - .31 | 25.9 - 23.4 | 32:45 - 27:15 |
| Virginia | .64 - .15 | 24.4 - 22.2 | 32:42 - 27:18 |
I will not value time of possession.
Statistical Prediction
As I stated after the Tennessee game, I think the overwhelming explanation for the score difference was exceptionally bad fumble luck, and could argue the game was almost a toss-up otherwise. Otherwise, the Hokies have certainly played up to the level of their competition and I don't think will be intimidated in any way by Clemson. Further, I think the changes in how the offense ran against Virginia will make the team more difficult to prepare for, and Clemson is much more likely to take the expected outcome for granted.
I see a close game, where Jerod Evans finally gets the national attention he deserves by matching or outplaying Deshaun Watson and frustrating the Tigers' defense. The Hokies pull off the upset and keep the ACC out of the playoffs, while ensuring they start 2017 ranked and with a Heisman-potential quarterback. This Kool Aid is delicious.
Virginia Tech 31, Clemson 30
As always a thanks to Football Outsiders, cfbstats.com, and Minitab Statistical Software.

Comments
I'll have some of that Kool-Aid myself.
LET'S GO!!
HOKIES!
I need some good Kool-Aid along with a win this Saturday to make me happy. Microcontroller Labs are killing me.
What flavor of kool-aid do you recommend as a mixer for the brown liquor of choice? I mean... I am all in on the kool-aid but a tailgate is not a tailgate without a good dose of brown liquor... am I right????
My Koolaid says Woodford Reserve on it.
Pour me a glass! Let's GO!
Also we owe clemson a surprising loss in the ACC title game. Be nice for Fuente to get that out of the way this year!
Kool-MF-Aid!!
Bring it, Clemson
UNC fan rationale
Nitpicking: shouldn't those win total percentages be for the season, not just the regular season? We are now in the post season after all, which is why LOLUVa is already well into their yearly tradition of staying home til next September.
That's why there's only a 10% chance of us getting 11 regular season wins.
/s
And loluva is still trying to get their equipment truck home from Mt. Tabor Rd.
Hope you are joking. If for nothing else than to help the people on Mt. Tabor Rd out.
I still want to know what the hell the truck was doing anywhere near Mt. Tabor.
they were trying to avoid traffic on I81
they think they're sooo smart...they really aren't. I would've taken 460E towards Salem to get around the accident (I think it was near MM 138ish) and then hopped on 81 from there.
silly wahoos...always bragging about their huge brains but never actually using them. It's a shame, really.
There were two accidents. One just south of ironto at 127 and one just south of 138. Google maps was routing you through Catawba because of the backups. I actually went down my tabor to get home and had to turn around because of the uva truck. I was too pissed and tired to try Harding and luckily 81 was basically clear by the time I rolled through (8pm)
I hear ya. But you'd think that in spite of Google's alternate routing, the driver of the UVA truck would see the GIGANTIC green sign that says GPS routing not advised. Unless, of course, that sign only occurs on the eastbound lanes of 460 coming down Brush Mountain, I can't recall.
#LOLUVA either way.
Mt. Tabor can be rough through there but took it a couple of times for a more scenic route to and from Tech before I found out 460 is the fastest route for me, faster than taking I-64.
Good summary, as always. I took a glance at the Roundtable explanation of their methodology (can't get to Catherwood's site on this computer for some reason...) and...it seems mathematically unfounded to me.
From their description:
"My basic rating is derived from comparing a team's performance against a given opponent compared to that opponent's "normal" game. For instance, if [Team A] is averaging a +10 scoring margin for the season, and [Team B] beats [A] by 7 – we call that a +17 for [B]. In English – [B] did 17 points better against [A] than they are used to."
My interpretation of that is that they compute a team's average margin of victory (or, presumably, defeat) and then interpret actual game results by comparing the *actual* margin from the game played to the *average* margin computed before. But that assumes, essentially, that average margin of victory across all opponents is the most important (and consistent!) factor in ranking teams. That's dubious for a number of reasons; it also wouldn't be valid from a BCS perspective because of its reliance on margin of victory.
Massey's original rating system used aggregate score margins for the season rather than a "departure from the average," which I think yields a more mathematically consistent result.
I've been thinking for a while about developing my own system which would utilize a two-part process; essentially a Massey or Colley system on the front end (although there are others that are also very interesting - I'm particularly keen on the "Random Walker Ratings" which I recommend you check out if you haven't done so), and then an optimization routine on the back end to try to minimize conflicts with the same sort of goal as Roundtree (i.e., try to minimize the number of times that higher-ranked teams wound up losing to lower-ranked teams). I haven't done it yet and it'll likely be a while before I do, but I'd like to think at least that such a rating system would be more stable than Roundtree's "let's get the whole optimization and rating piece done in one bite" system that produces clearly nonsensical results.
Here is the system explained. The system rates offensive and defensive performance and then applies factors for how the team does at home and how much they win. Not sure exactly what it means for how much the team wins. Then they gain or lose rating points based on how the team does against the spread. The major part of this ranking system is when a top 10 team loses. The points lost are multiplied by a factor of 3 for some reason.
Interestingly enough, it is predicting a 31-30 Virginia Tech victory, just like Joel.
Yeah I found the link, just couldn't access it because of whatever firewall is going on (I guess it doesn't like angelfire websites?)
I've seen "offense/defense" rating systems before (Massey developed one such system in his original honors thesis; the same one in which he developed the least squares methodology).
It seems odd to me that the system would arbitrarily multiply *some* losses by a factor of three - I'd think it'd make more sense to use some kind of linear (or non-linear? Maybe logarithmic makes more sense...) scaling that is applicable to all teams being rated, and would have something to do with the "distance" in rating between the two teams. So, a top-10 team losing to another top-10 team probably wouldn't be as amplifying as, say, a top-10 team losing to a team ranked, like, 100.
But I need to look more into it.
Yeah I found it weird too. Forgot to say that when the 10th ranked team loses, a factor of 1.1 is used. The rationale behind these top-10 loss factors is that these losses are "bigger". The explaination doesn't say their are similar "big" loss factors after the 10 ranking. Just does not seem like good statistics. It really is arbitrary.
Edit: Just reread it. I completely misread what it was saying. Lack of sleep really gets after ya.
Still not sure what the scale is for the factor. This is an extra factor for points loss, where the rest is equal points gained and lost for the winning and losing teams based on actual score versus the spread.
Based on that logic, the number 1 team being "upset" by the number 2 team would have exactly the same (profound!) impact as the number 1 team being "upset" by the number 200 team, right? Again, I would argue that the "sliding scale" idea has some validity - but this is *supposed* to already be wrapped up in the strength-of-schedule calculation that sits behind everything; and if you really *want* to make it more profound, then the scaling should probably be related to the relative "rating scores" between the two teams (NOT the relative ratings - because, say, if the top 20 teams all achieve near-parity, then you have an "any-given-saturday" scenario and it would unfairly penalize team #1 for losing to team #20 when the difference between them is theoretically slight; or, at least, more slight than the 19-place differential between their aggregated rankings).
We're gonna Wiiiiiiiin!
Not sure about calling Tenn and UNCheat "elite" teams. Compared to the rest of our schedule, yes, but nationally, no. I'd call them and Pitt good teams with everyone else on our schedule being average or bad teams.
Anyway, thanks for the numbers and analysis. Always enjoy it.
Miami has same record as Pitt and whipped them pretty good. Keep in mind we beat Pitt by 3, UNC by 1, and Pitt beat Clemson. It's starting to look like Miami was about as impressive of a win as UNC. I agree that Tennessee and UNC aren't "elite" though, but Tennessee talent-wise is in the upper-echelon.
...ahem...we beat UNC by 31 but if you take away the hurricane
Two observations:
1) It appears this game might look a lot like a Louisville spring game
2) I will value time of possession.
I was waiting for this to show back up to ask why regression was used here.
To show how time of possession linearly affects score differential.
Also to give the potentially more valuable insight that the time of possession explains almost none of the variation in score differential. If there are things to focus on to improve your chances, the thing that explains 6% of the variation is probably not as important as scheme, and talent...
Without some analysis of the variation this is basically a useless graphic though. Can't tell if the line is bigger than you would expect from just variance...
this graph was originally created as a foil to this one:

The idea was to show that if you wanted to predict a score differential, you were significantly better off knowing points per play than you were knowing TOP differential. Both graphs were created from all results in the 2005 season (because football stats would let you download the csv for free).
Clemson's PPP: 0.47
Our PPP: 0.44
Dis one gon b gud
These were per game statistics. Therefore, they were really more descriptive than prescriptive. Joel's original thesis was that winning TOP did not mean you were the better team in the game or even across a whole season.
It's kind of a useless experiment, but my data is only to be used to say that the team that scores more points per play in a particular game usually had a proportionally similar advantage in points. Comparing before a game has the downfall of varying quality of opponents. We had .64 points/play against both BC and LOLUVa. If we faced similar opponents all year (say we were the big fish in a G5 conference), that stat would be significantly higher than a better team with a harder SOS and would have little bearing on the result of a match up between the two.
I understand what a regression line is, what I mean, though, is that even before any analysis is done, it should be plain to see that the same TOP in two different games could show wildly different scores for those two games. Further, this regression attempts to relate the size of a TOP difference to the size of a score difference (i.e. if there is a small TOP difference, the score should be tight, whereas a large TOP difference should show a large difference in score), which has never been the claim.
To me, TOP and Win/Loss are both binary, instead of continuous variables, and score differential has nothing to do with any of it.
that's why I added the shading in the quadrants, to reflect the binary results. I can't find my spreadsheet right now, but it was something like 60% of the data points fall in the green. So that's a little better than a coin toss.
It looks pretty even. I'm curious if there are certain teams that tend to be redder or greener than others, like a GT/Navy option team who likely wins TOP almost all the time, or a team like Chip Kelly's Oregon teams who rarely held the ball but almost always won. I wonder if the great teams, like Alabama, have a strong tendency for winning TOP and if bad teams, like LOLUVA, tend to lose TOP.
Honestly, I think it's a great big ball of convoluted mess. A great team like Bama wins TOP because they tend to hold their opponents to more 3 and outs and spend more time scoring than their opponents do losing control of the ball. GT wins TOP, but has tends to come up scoreless on those long (time-wise, not necessarily yardage-wise) drives. On the flip side, teams that tend to give up big plays will likely do better in TOP because their opponents take less time to score and, most of the time, you get the ball back after your opponent scores(see: most everyone who played Chip Kelly's Oregon). Along these lines you have situations like one last week where LOLUVa had the ball for ~7 minutes of game time and came away with 3 points and allowing 7 (11:27-4:41 in the 3rd). They dominated TOP for that quarter but had little to show for it points wise. And this is not even touching on intentional clock management like Joel mentioned.
Long story short: TOP, as a stat, has little to do with causing a team to win the game because there are way too many ways it can be skewed independent of the score.
Go back and look at the Score diff vs. PPP chart. Estimate how many data points would end up in the red there.
Yeah you can make just about any statistic support just about anything.
I saw the score diff vs ppp chart, but I don't think it's a grand insight that the more points you score per play than your opponent, the higher your margin of victory.
I'm not big on margin of victory measurements. I'm much more interested in looking at wins vs. losses, because we aren't looking to score points, we're looking to win games. Syracuse put up 61 last weekend and lost. Alabama beat LSU 3-0 in 1979. Total points isn't a concern to me.
Not saying it's a grand insight. This whole thing started by saying that PPP is a more useful statistic to track than TOP.
Margin of victory just made for a prettier graph than only having wins vs losses, but you can look at the graphs and see that winning TOP only jives with winning the game 60% of the time while winning PPP does it 90%-ish.
As Joel said elsewhere, if you had to pick one statistic to beat Clemson in other than final score, which would you pick?
I mean, that's kinda the point. PPP tracks points. Wins are determined by points. It's like saying if I profit more than my competitor then I'll be more profitable than my competitor.
If you ever saw the movie Moneyball (I never read the book), Jonah Hill's character was focused on getting on base. Getting on base leads to runs. Runs leads to wins. He engineered victories via the indirect strategy of just getting on base. But trying to maximize points per play draws a direct line to maximizing points, so it doesn't add any new information, it just suggests that it's a good strategy to try and score on any given play, which is already something everyone always tries to do anyway. It would be like Hill's character suggesting to the boss that they should try to have more runs scored per pitch than their opponent, and the wider that difference, the wider the margin of a likely victory.
So it's not really a statistic I'd track unless I also tracked the number of plays my opponent and I ran. If I wanted to beat Clemson, the only piece of data I want in our favor is the final score (duh). This season, Clemson has averaged 81.4 plays per game, while we have averaged 79.3. In the last 3 games, Clemson has widened that margin (87.7 to 81.3 plays per game). So if I chose points per play, I'd have to ensure that the difference was high enough to make up for the fewer plays we run (assuming the ACCCG stats reflect the season-long average). I don't need to tell you that the math is easy - on the season-long average, we'd need to average 3% more points per play to beat Clemson, on the 3-most-recent-games basis, we'd need to average 8% more points per play to beat them, meaning that, if the expected play counts for each team hold up in the ACCCG, it's not enough to root for additional points per play unless we take into account the number of plays we run.
You know what we need to do, then? Run more plays than the opponent as well. If we run more plays than the opponent, you know what might be in our favor? Time of possession.
More importantly than any arguments about regression or strength of relationship or other stats: the presumption being made whenever this stat is cited is that it is time of possession CAUSING winning, whereas the reality is that the true relationship is much more likely the other way around. Teams that are winning intentionally increase time of possession by killing clock, and teams that are losing intentionally decrease their time of possession by trying to stop the clock. The presumed relationship if the opposite of the real one.
But even if we ignore that flaw in reasoning, if I told you we could either beat Clemson in points per play or in time of possession on Saturday and let you pick which one, what would you choose? Thought so.
Time of possession, of course. Glad we agree!
the internet is so useful...
disclaimer: I did not actually watch this video. Just linked for the title/subject matter.
Ugh just so everyone knows it's entitled 'Euthanizing a horse with a gun humanely - Proper bullet placement - Rick Gore Horsemamship'.
haha...you have to admit..that's kinda funny
I'd take turnovers.
That's wonderful. It's also demonstrably inaccurate for this VT team.
I'll repeat: I will value time of possession.
[Note: That doesn't mean I will value it above all other statistics.]
Sorry to resurrect this, but I stumbled across this XKCD and it was too perfect of a fit. The R-squared value is even the same...
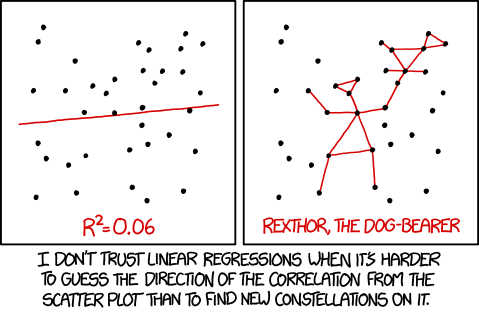
I had a feeling you were pretty smart.
Whoa there cowboy...you're getting way ahead of yourself.
So...you're saying bet the mortgage on the spread and the rest of the bills on the moneyline? Got it.
I think there is booze in this Kool Aid.
Scheme-wise it is extremely similar, and I mean extremely. Venables uses DL differently sometimes, but he also has blue-chip guys all across his DL two-deep. Coverages, run blitzes, etc often mirror ours very closely. OJ Howard's second long TD against Clemson in the NCG was actually a beautifully designed play by Kiffin to beat Clemson's... wait for it... inverted cover two.
edit: There was a really good wide view video of that play on twitter that I favorited and quote tweeted but it seems the video was deleted or it was a now defunct Vine or something.
It's ALL gonna be about 3rd down conversions. If the Hokies can muster up some OSU 2014 3rd down magic, they've got a shot.
That one prediction all the way to the left:
Clemson right now:
The hope is Clemson spent there perfect game on South Carolina, and is now heavily focused on the BCS match-ups. No need to worry about us.... wink,wink.
Pass a cup of that Kool Aid! I like the prediction of 31-30, but I'm not sure emotions can handle watching a close game.
I'm not scared of a close game. I think that'd be fun actually since we're not expected to do much.
Depends, is Joey kicking from > or < 40 yds?
I like the taste of this kool-aid.
via GIPHY" target="_blank">
I was hoping you would put this together; however, I was really wanting to see something that showed some hidden edge we would exploit to pull this off.
Sounds about right. This will have to be and underdog chip-on-the-shoulder game to pull of the W.
Do you like grapes?
HOW YOU LIKE DEM GRAPES!!!
CHEERS TO THAT!!!
BEAT BAMA!
(I mean, Clemson.)
I'm lost on the Genesis of the TOP issue. Is it a joke? Do we value it? Does Horse value it? I'm so confused. Seems like I should value PPP not TOP.
Yes. In the first installment this season, Joel outlined why that's correct. For a while it was a joke to say you valued TOP. Then Horse really started doubling down on the joke and making absurd arguments for why you should and I decided to throw out some graphs and it just snowballed from there.
On my phone so I don't feel like looking up links but I'm sure someone could help a brotha out.
Yeah in the first installment Joel made a deal about not valuing time of possession and a few people took it as gospel so I've been harping on it all season long.
I am about to make a bold proclamation - in an improvement of the points per play statistic, I am going to value total points scored in a game, but only in consideration of the margin between the total points we score in a game vs. the total points our opponents score in the same game.
this sounds like the most horsesh*( statistic ever invented
I don't value TOP, but I certainly look at it. Take the Notre Dame game. In 1st quarter they dominated TOP something like 12:3 and our offense had 4 yards. Yeah, the defense didn't look great and gave up big plays. But when the offense keeps going 3 and out and can only muster 4 yards in a quarter, you can't ride the defense but so hard. TOP is one of those stats that can be influenced by any number of factors, but when taken in context can provide some insight into the game. TOP is not an accurate predictor of wins/losses. As HOAT said, some people have taken it as gospel and will jump all over you for mentioning TOP. Kind of like how you can't provide any personal insight without someone screaming "#SAUCES????!?!?!?!!?!?!??!?!"
There is literally no chance we win this game. The team shouldn't even bother showing up.
There is literally a 23% chance, according to these stats.
shhh just let him do his thing
Whaaaaa? Whatever you have been smoking, I want some. Will come in handy for our beatdown of Clemson Saturday night!
Opportunity for ACC championship in first year of Fuente era, opportunity to get some revenge on Clemson, opportunity to create CFP chaos. And I'll be watching it all within stumbling distance of my favorite brewery (Apocalypse). This weekend is gonna be LIT.
You're going to have a taste of that Lustful Maiden at Apocalypse? I'm very jealous.
Actually no. I don't really care for Belgians. Lustful Maiden is alright, and I'd drink one if someone handed it to me, but normally I'd pass on that in favor of the Golden Censer, Heavy Red Horseman, Hell's Frozen, Hoppocalypse, and 6h Seal.
Ok fair enough. Lustful Maiden is my favorite by them, but just about all of their beer is delicious. I really like 6th Seal as well and Hoppocalypse is of course a fantastic Red IPA.