

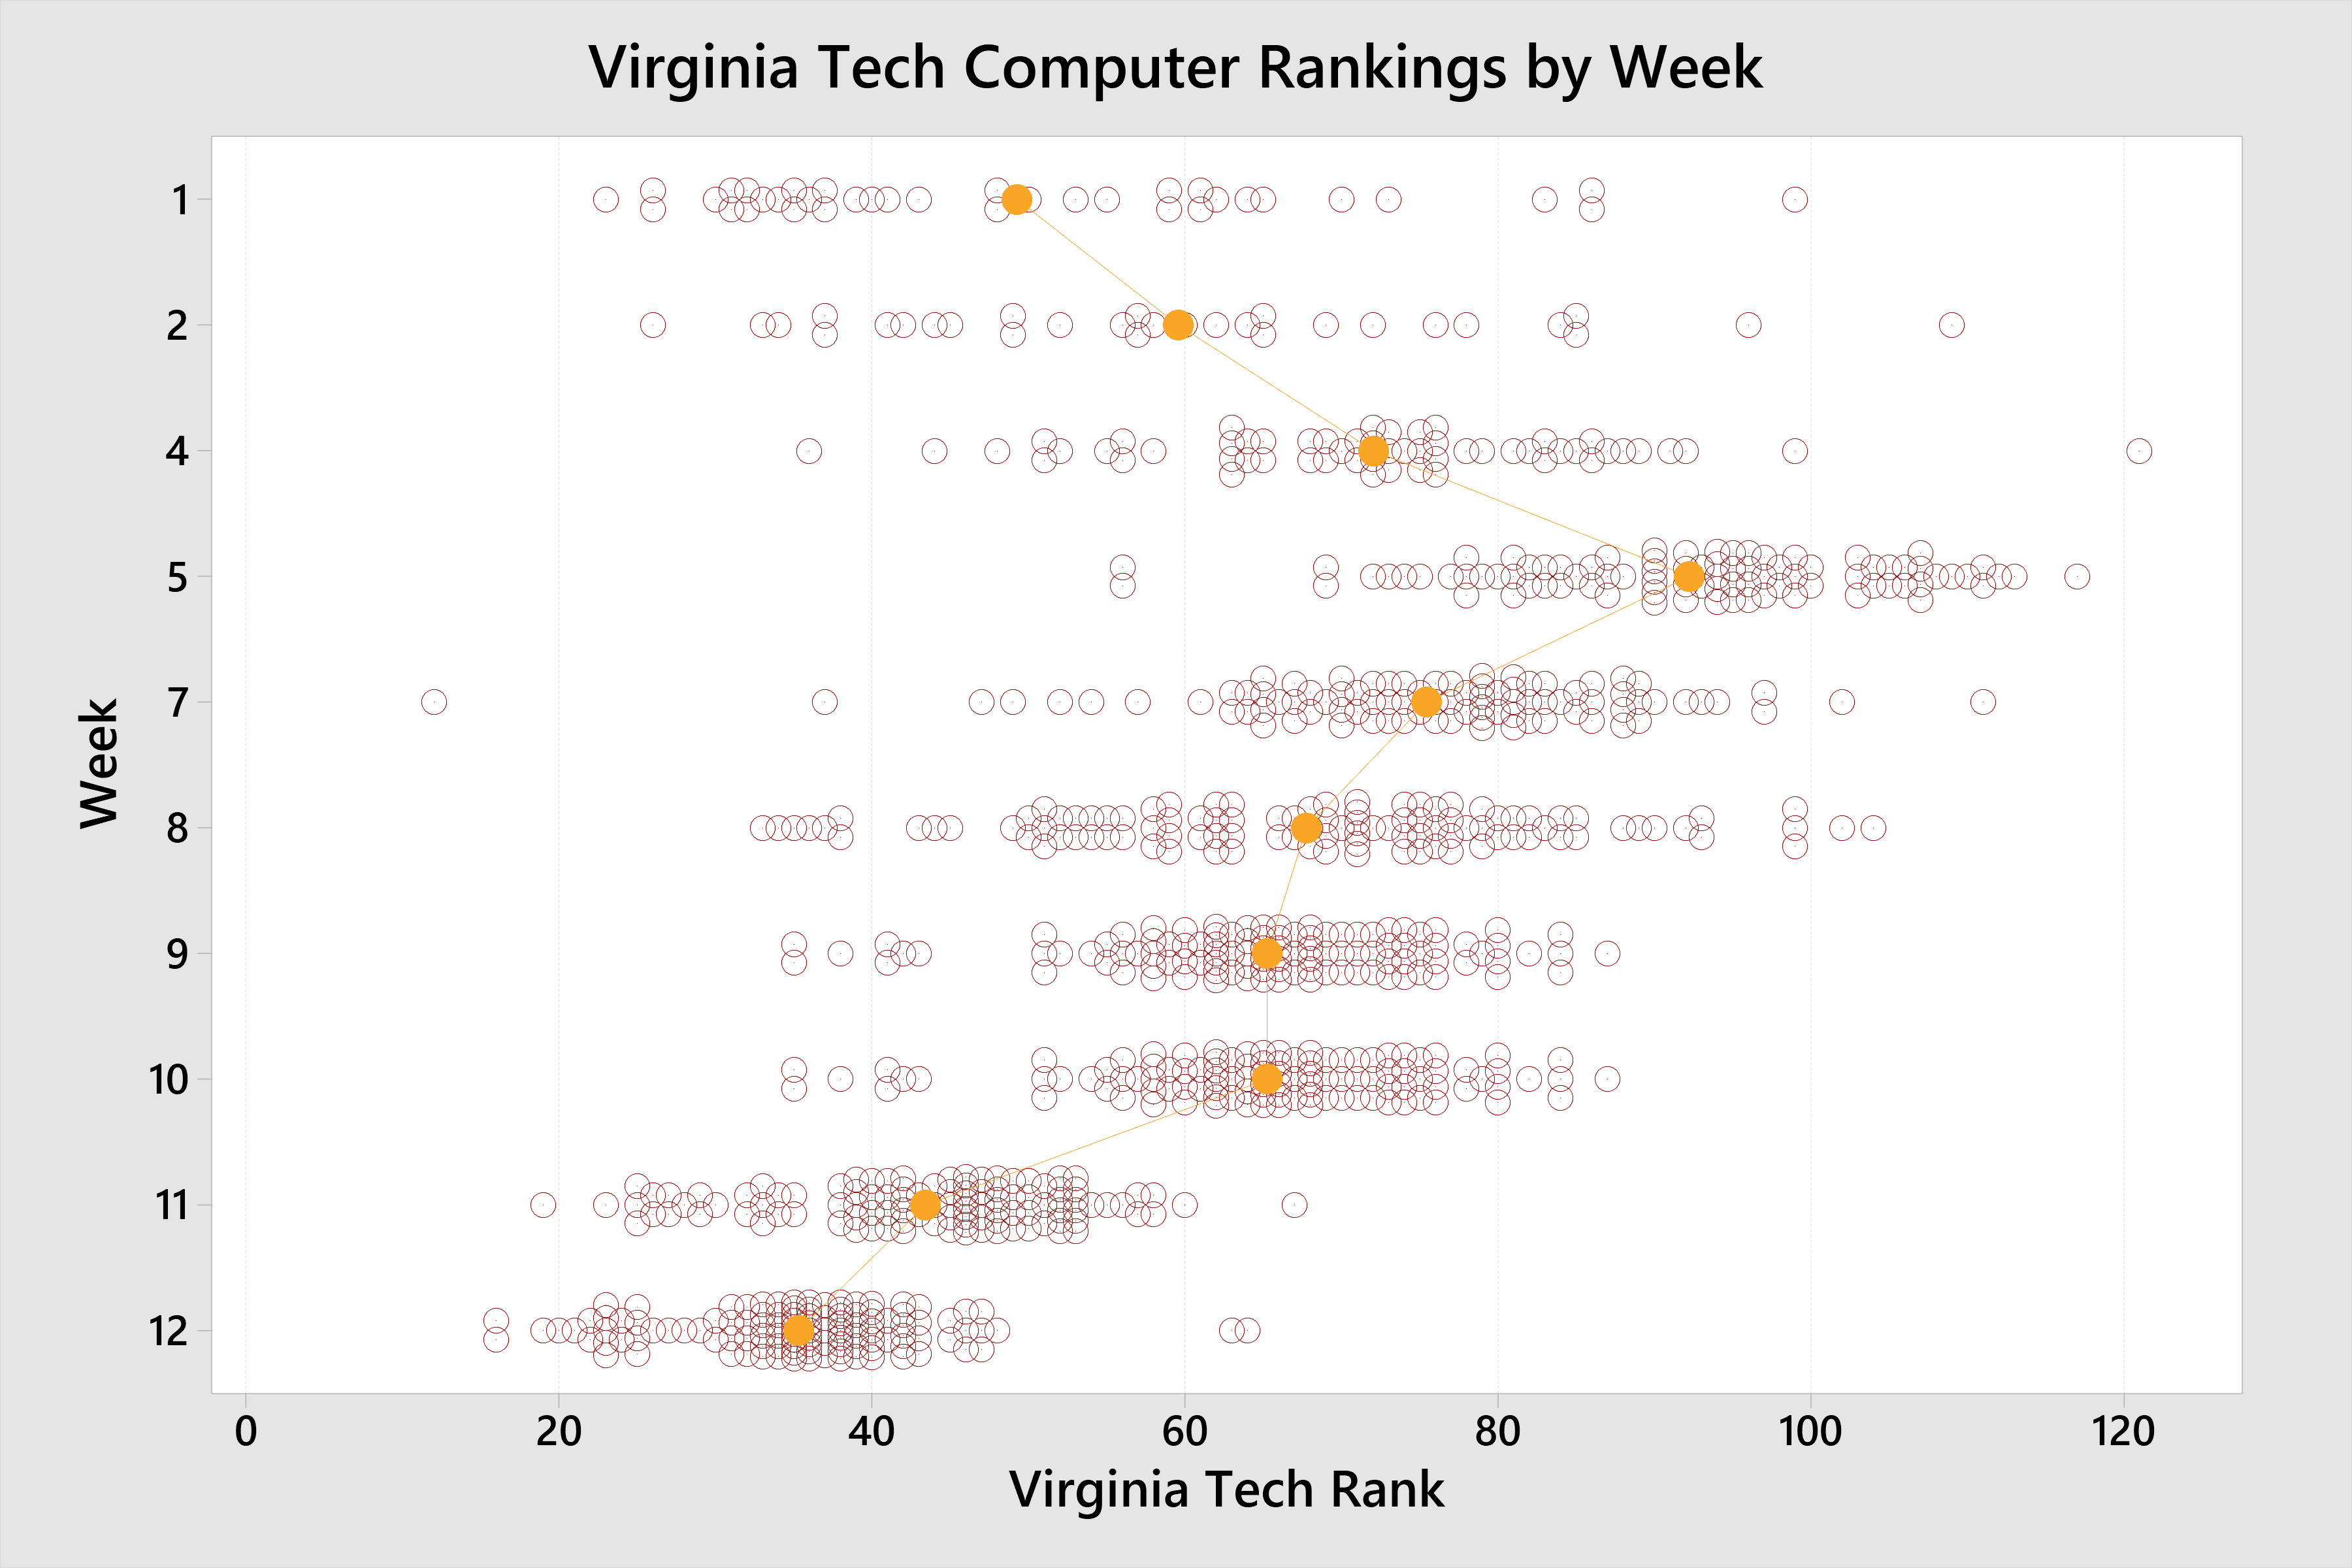
Over the last two months Virginia Tech has completely transformed its season from a near train wreck to the cusp of a division title. To help highlight and provide a new perspective on how it went down, I illustrated the turnaround in graphical form. The results are captivating.
The charts below correspond to the BTAN analysis done that week, in other words before the Hokies faced the following opponents:
| Week | Upcoming Opponent |
|---|---|
| 1 | Boston College |
| 2 | Old Dominion |
| 4 | Duke |
| 5 | Miami |
| 7 | North Carolina |
| 8 | Notre Dame |
| 9 | Wake Forest |
| 10 | Georgia Tech |
| 11 | Pittsburgh |
| 12 | Virginia |
Virginia Tech composite computer ratings by week:
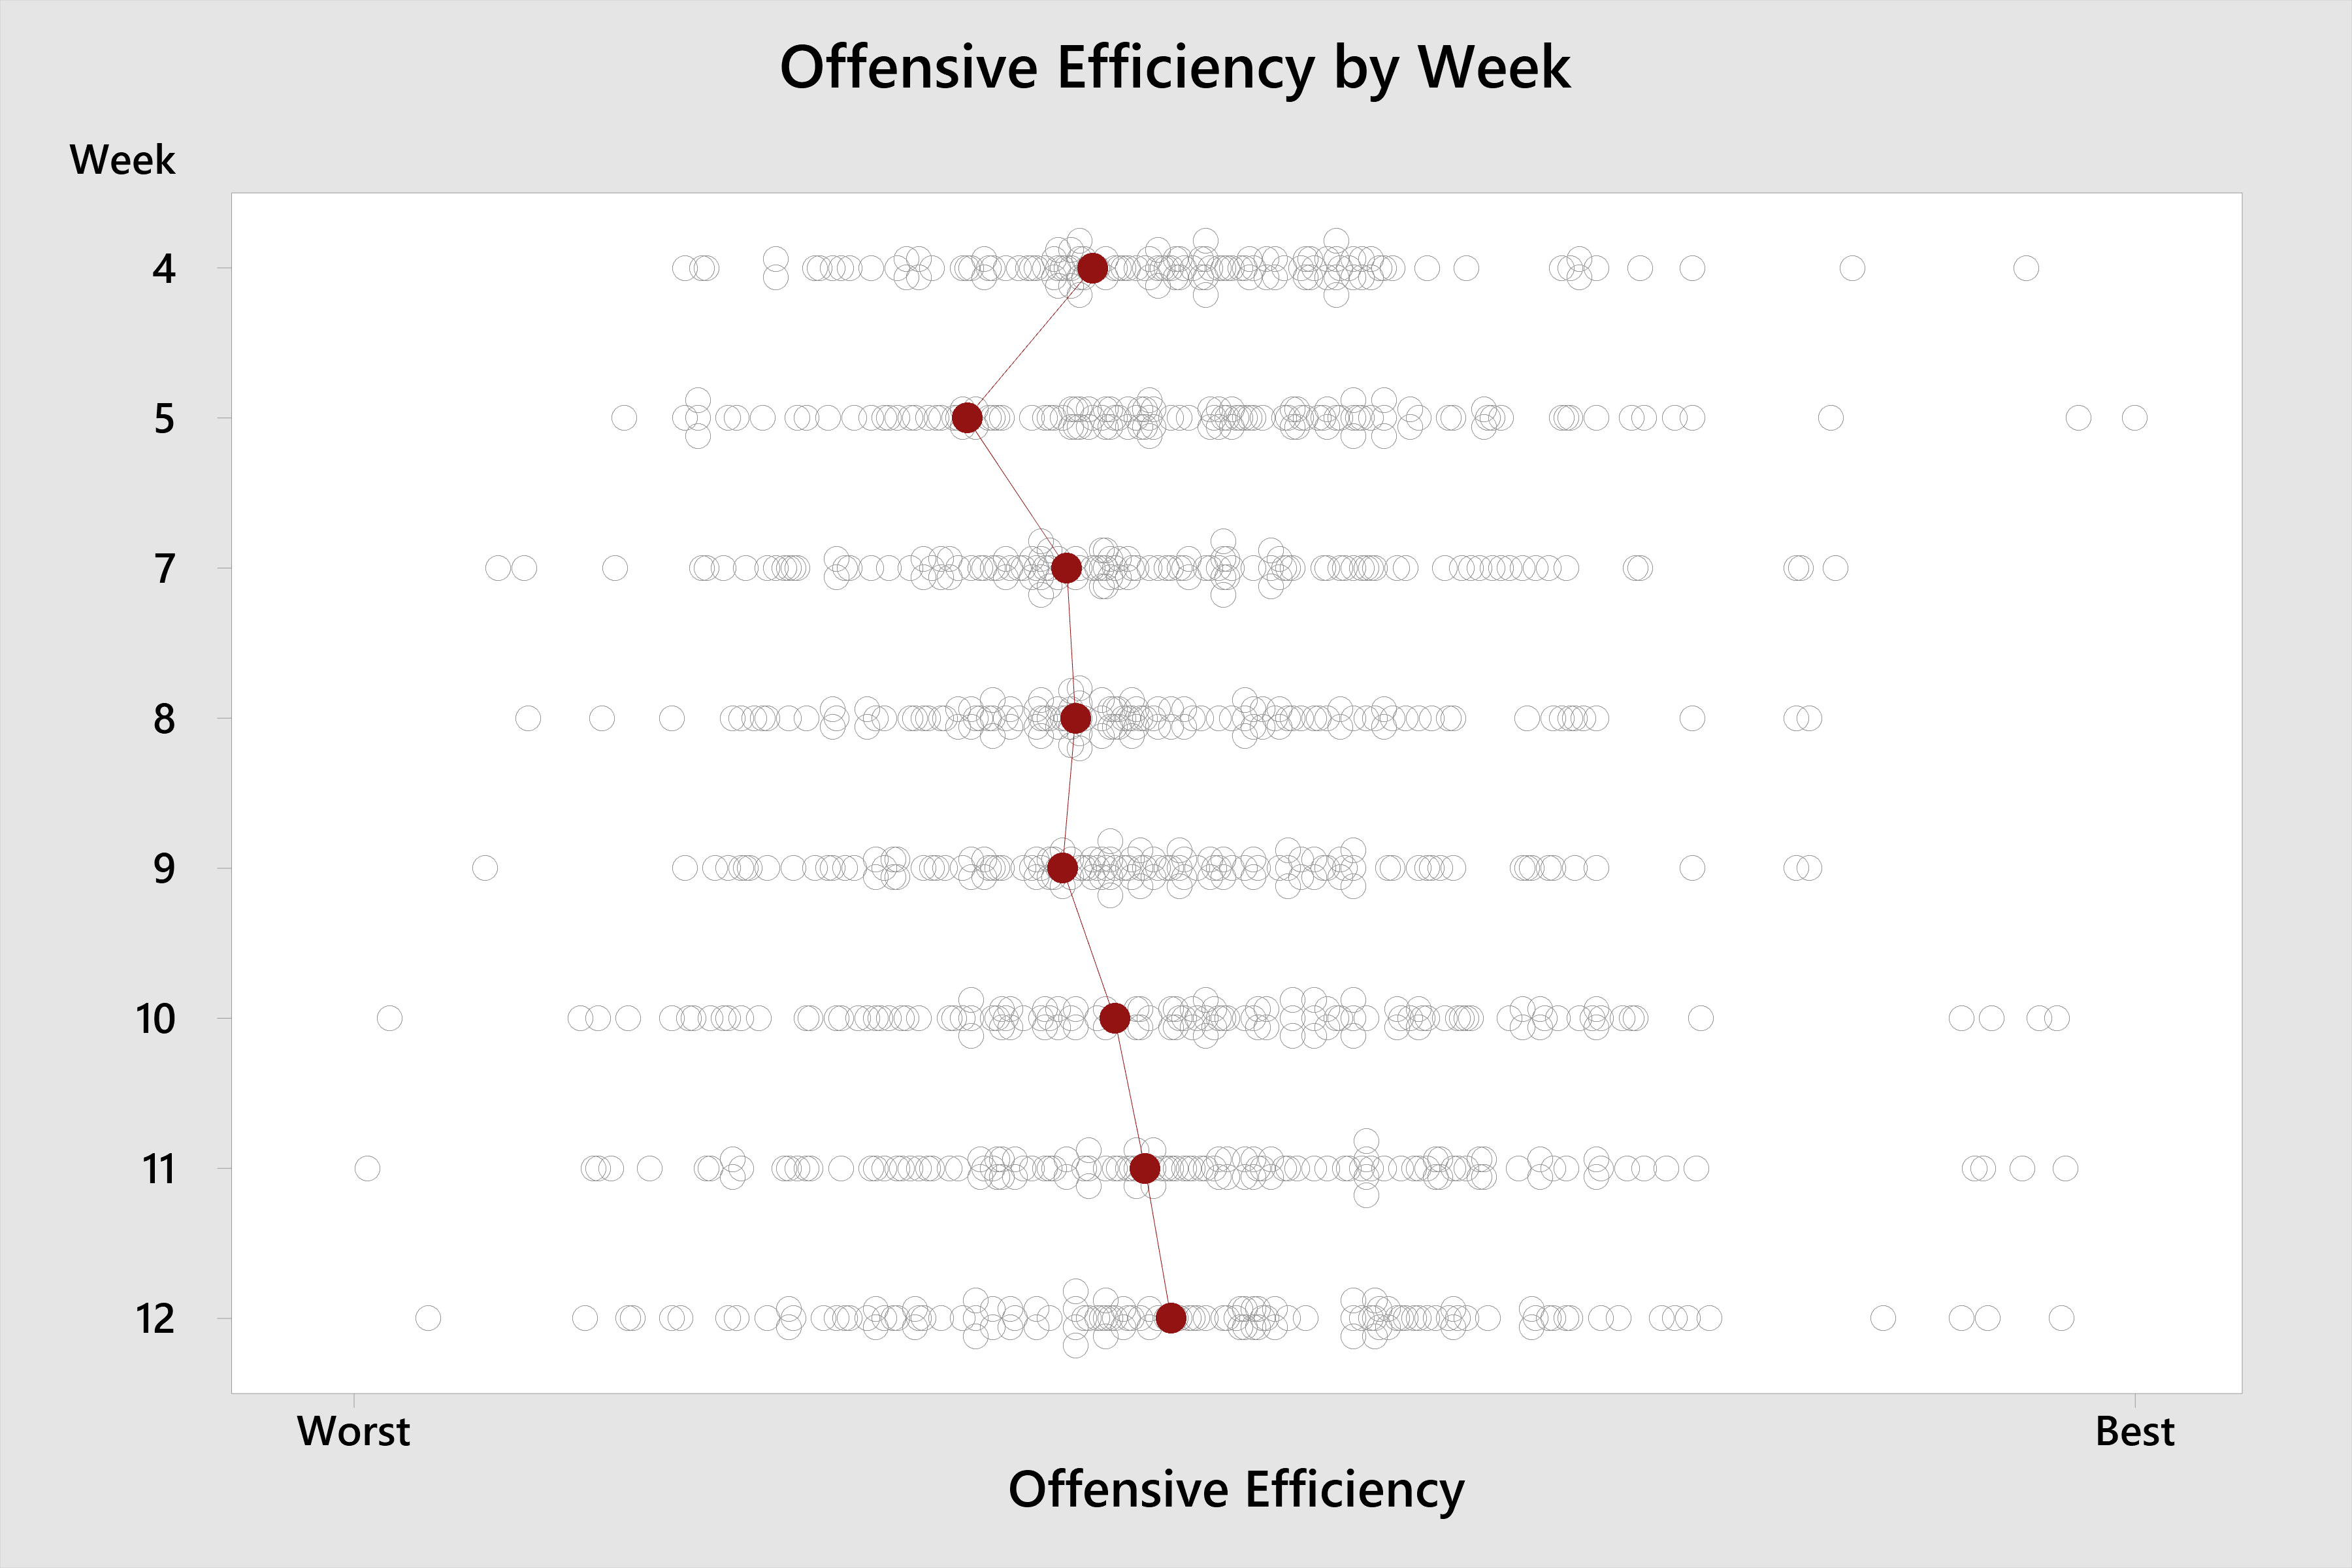
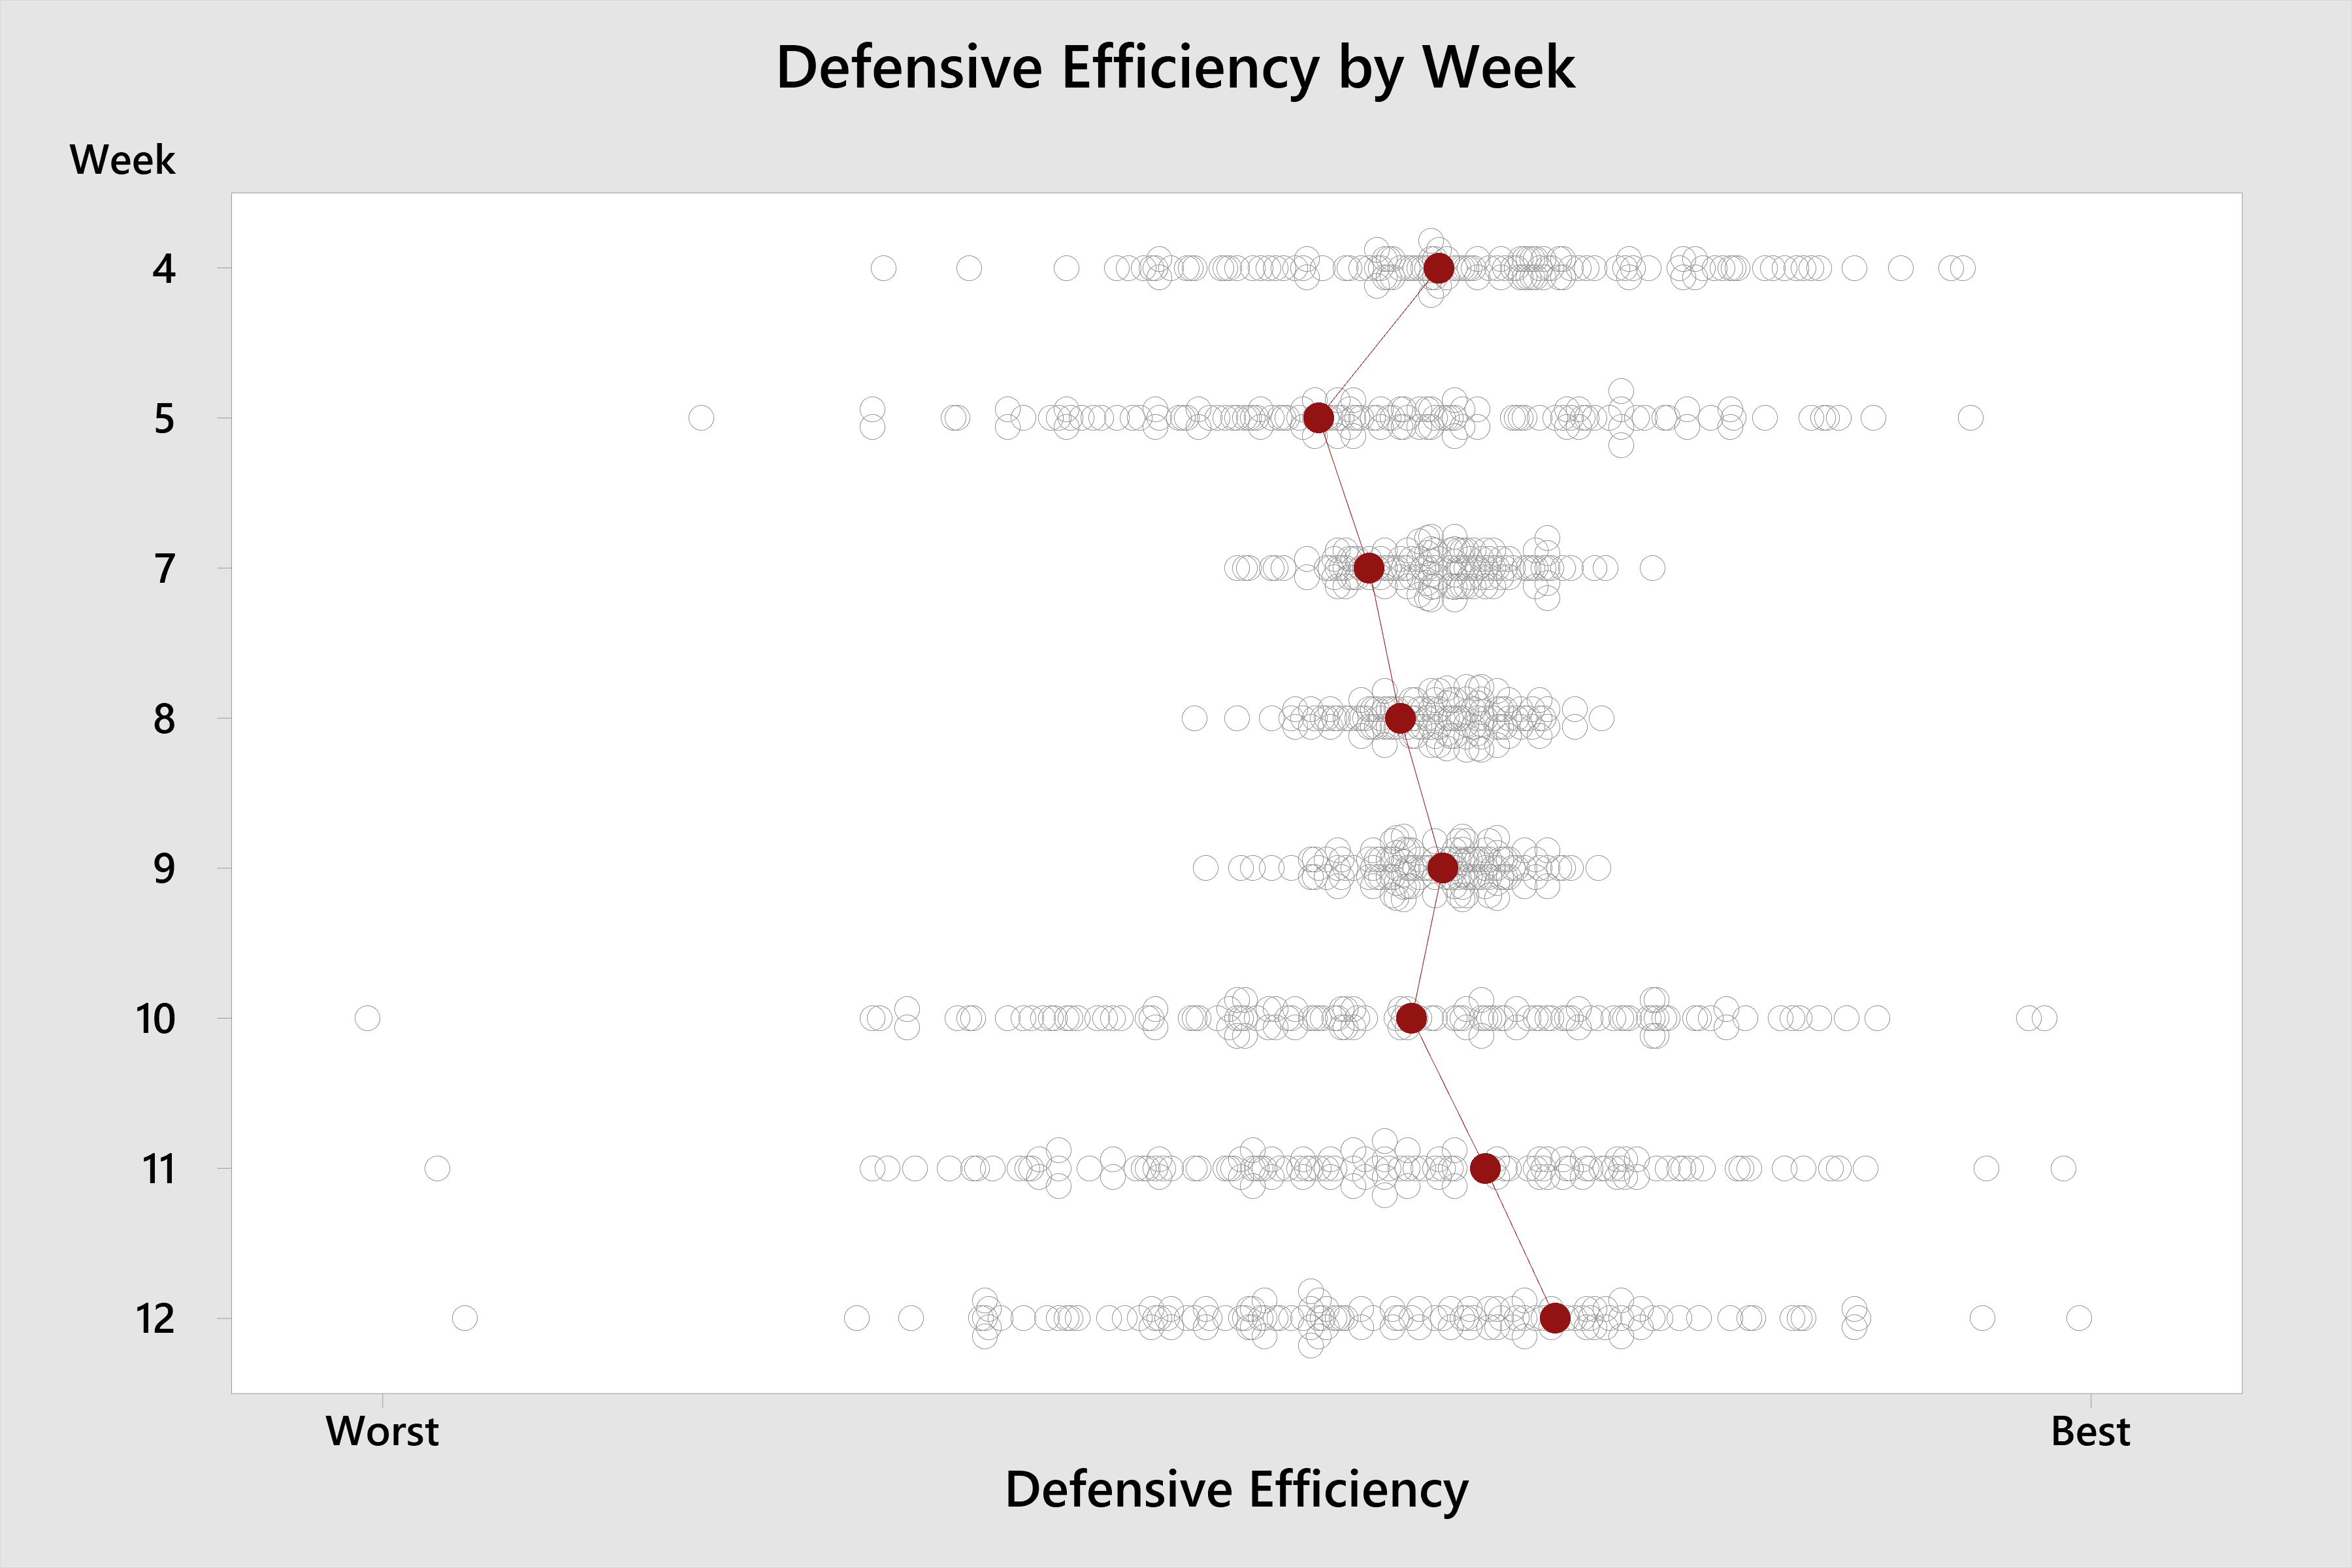
A look at the Hokies' FEI offensive and defensive ratings by week provides insight into how Virginia Tech achieved this transformation:
All of the above translated into the following predicted and actual game scores as the season progressed:

Which added up to these chances of each possible number of wins:
Join the Key Players Club
Exclusive content, advanced site features and a members-only forum — minus the pesky display ads.
