
Hokie Nation always has high expectations and an optimistic outlook at the start of the football season. In the last three years, fans were snapped back to reality early on. Conference and national relevance always seems like it's another season away, but in 2015 the program needs a big step forward to keep the hope alive. What are the numbers' take on reality.
The Schedule
Multiple computer rankings project teams before the season begins. Most don't share their formulas, but those that do often factor in things like:
- How each team finished 2014
- Who left (usually based on how much they played)
- Who has arrived (often using recent recruiting) and is staying
There are a number of factors that humans would consider important that aren't usually used such as coaching changes, performance in practice (a 3-star recruit reported dominant in practice counts the same as one unlikely to see the field), and unusual circumstances (such as Michael Brewer transferring last year and having little time to practice with the team). So with them one must always consider whether those factors exist in any meaningful way. A good reality check is Las Vegas, which takes everything into account remarkably accurately.
For those computers with preseason rankings, here is how the Hokies' schedule plays out in terms of opponents rankings.
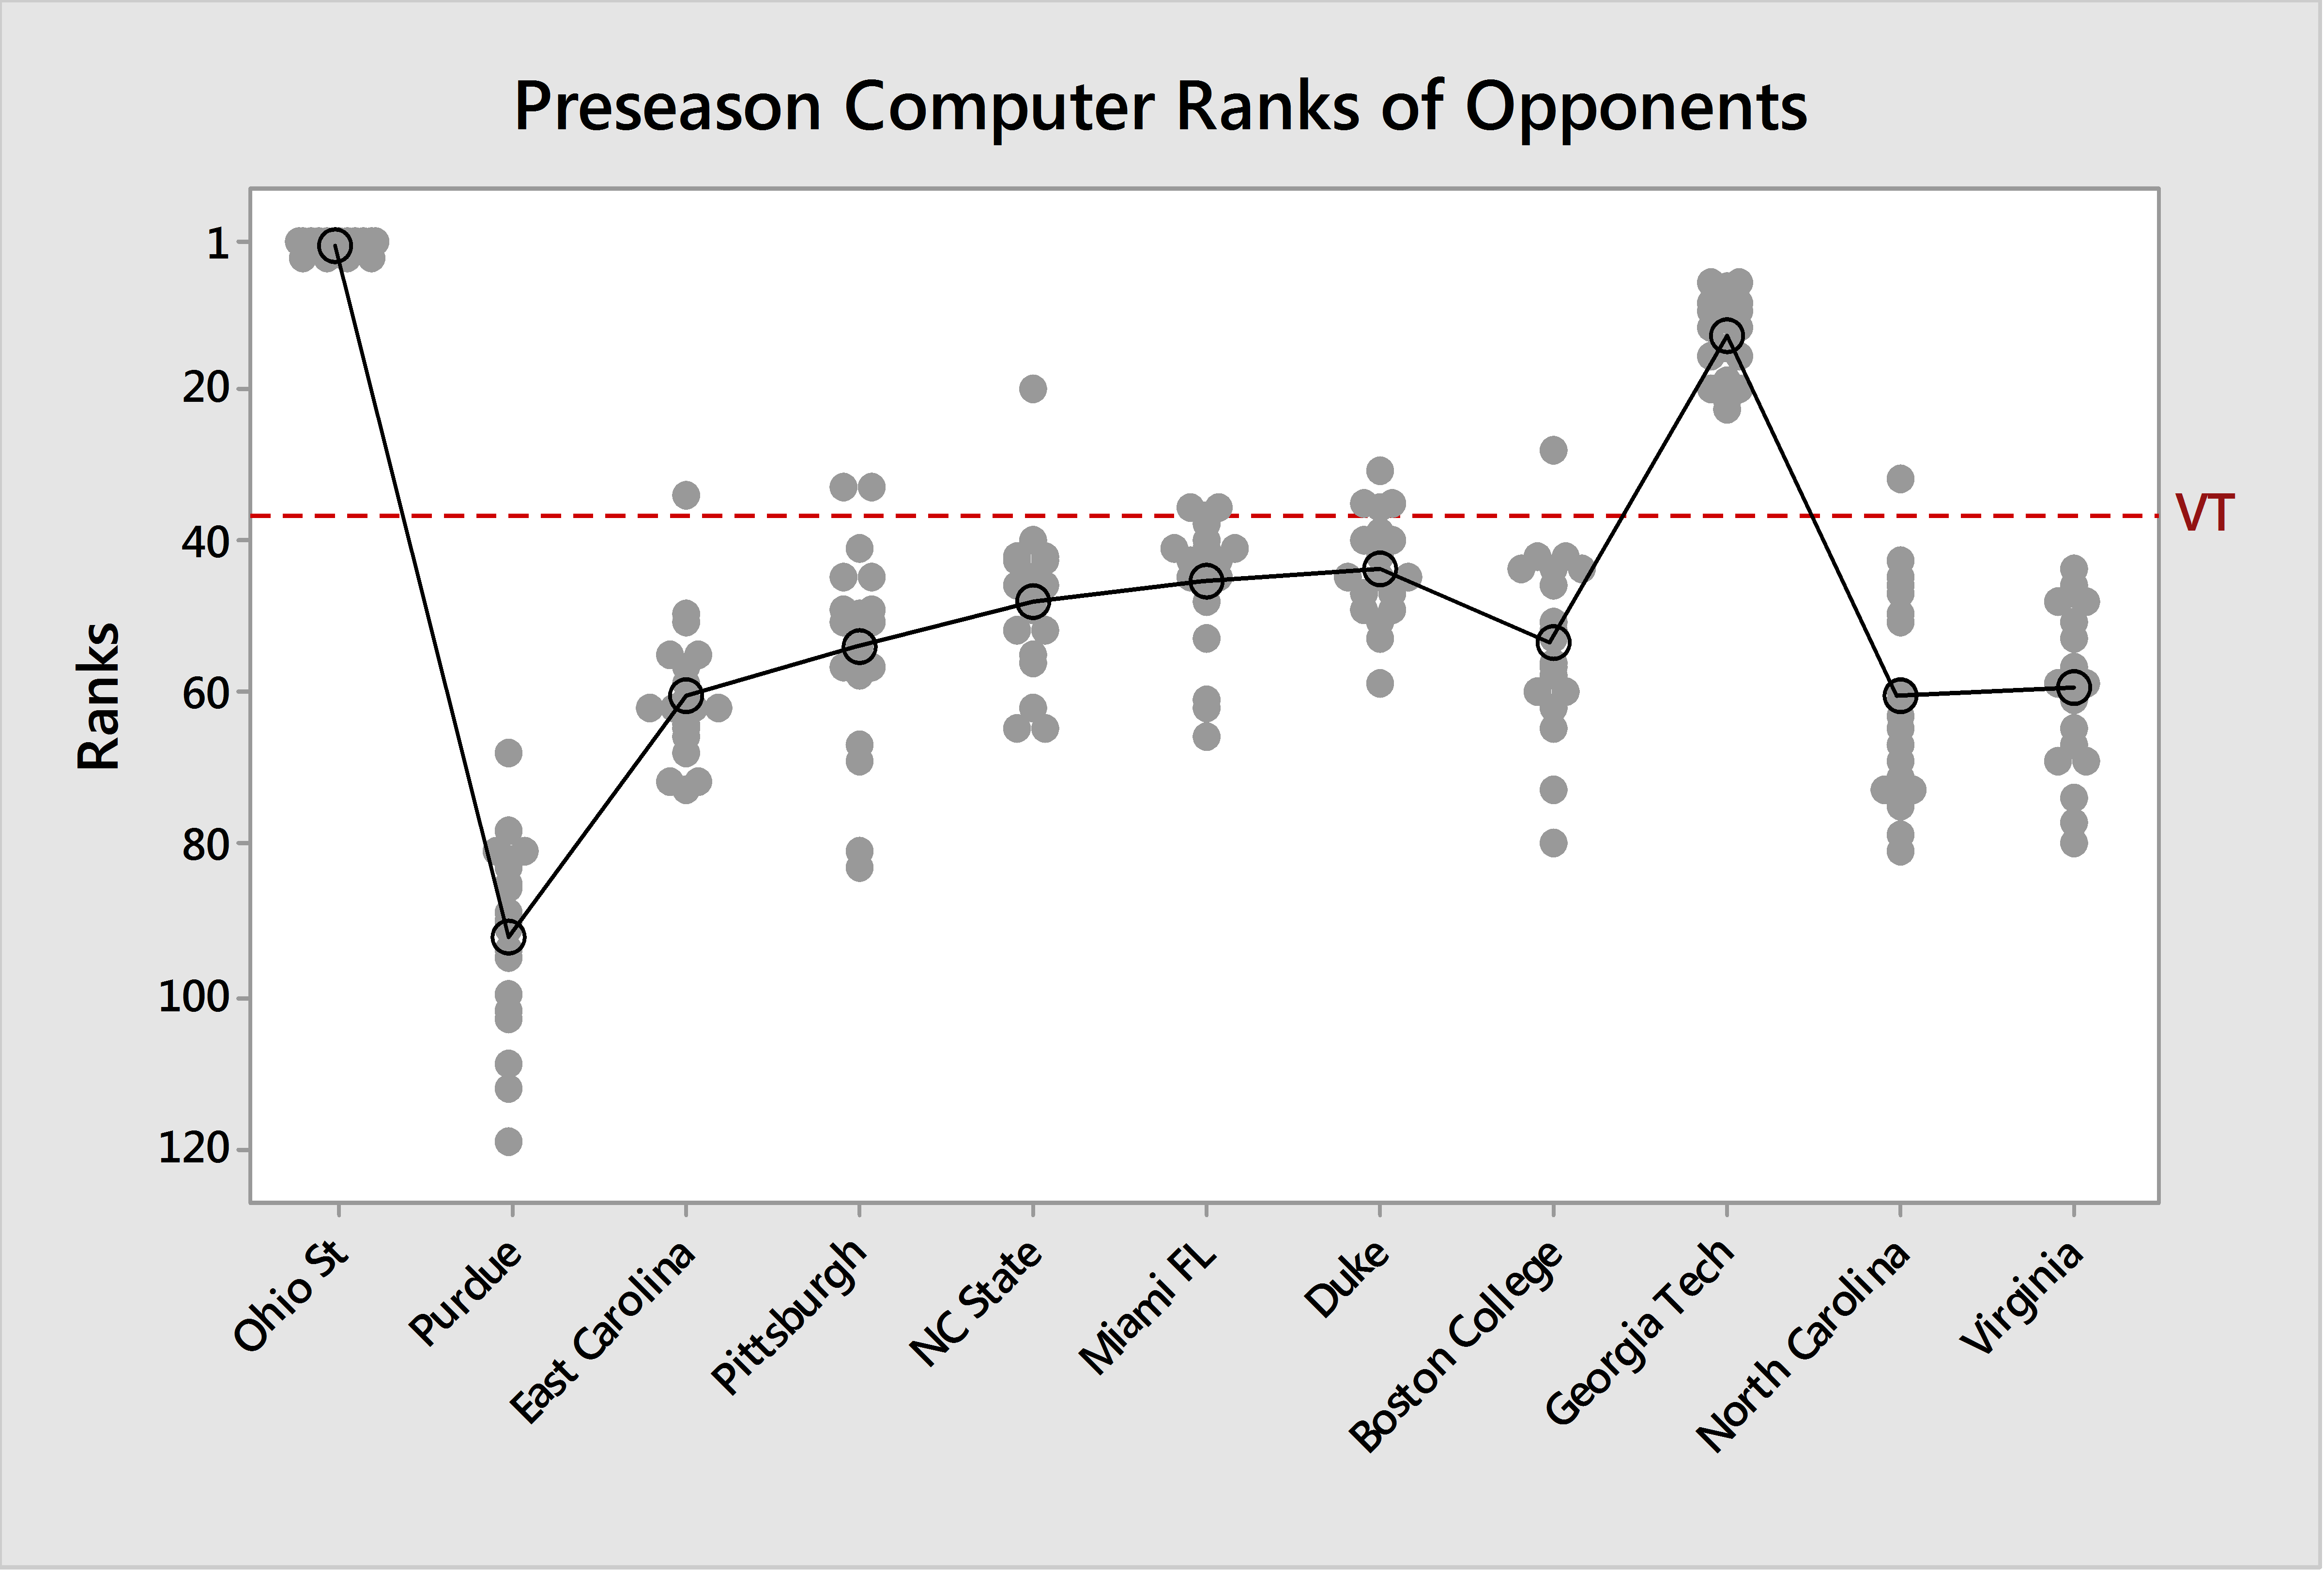
Two terms enter the season ranked above Virginia Tech: Ohio State — who more often than not is ranked preseason No. 1 — and Georgia Tech, who is surprisingly under the radar. Many of these can be combined into a predicted score difference and odds of winning, each of which factors in the game location.
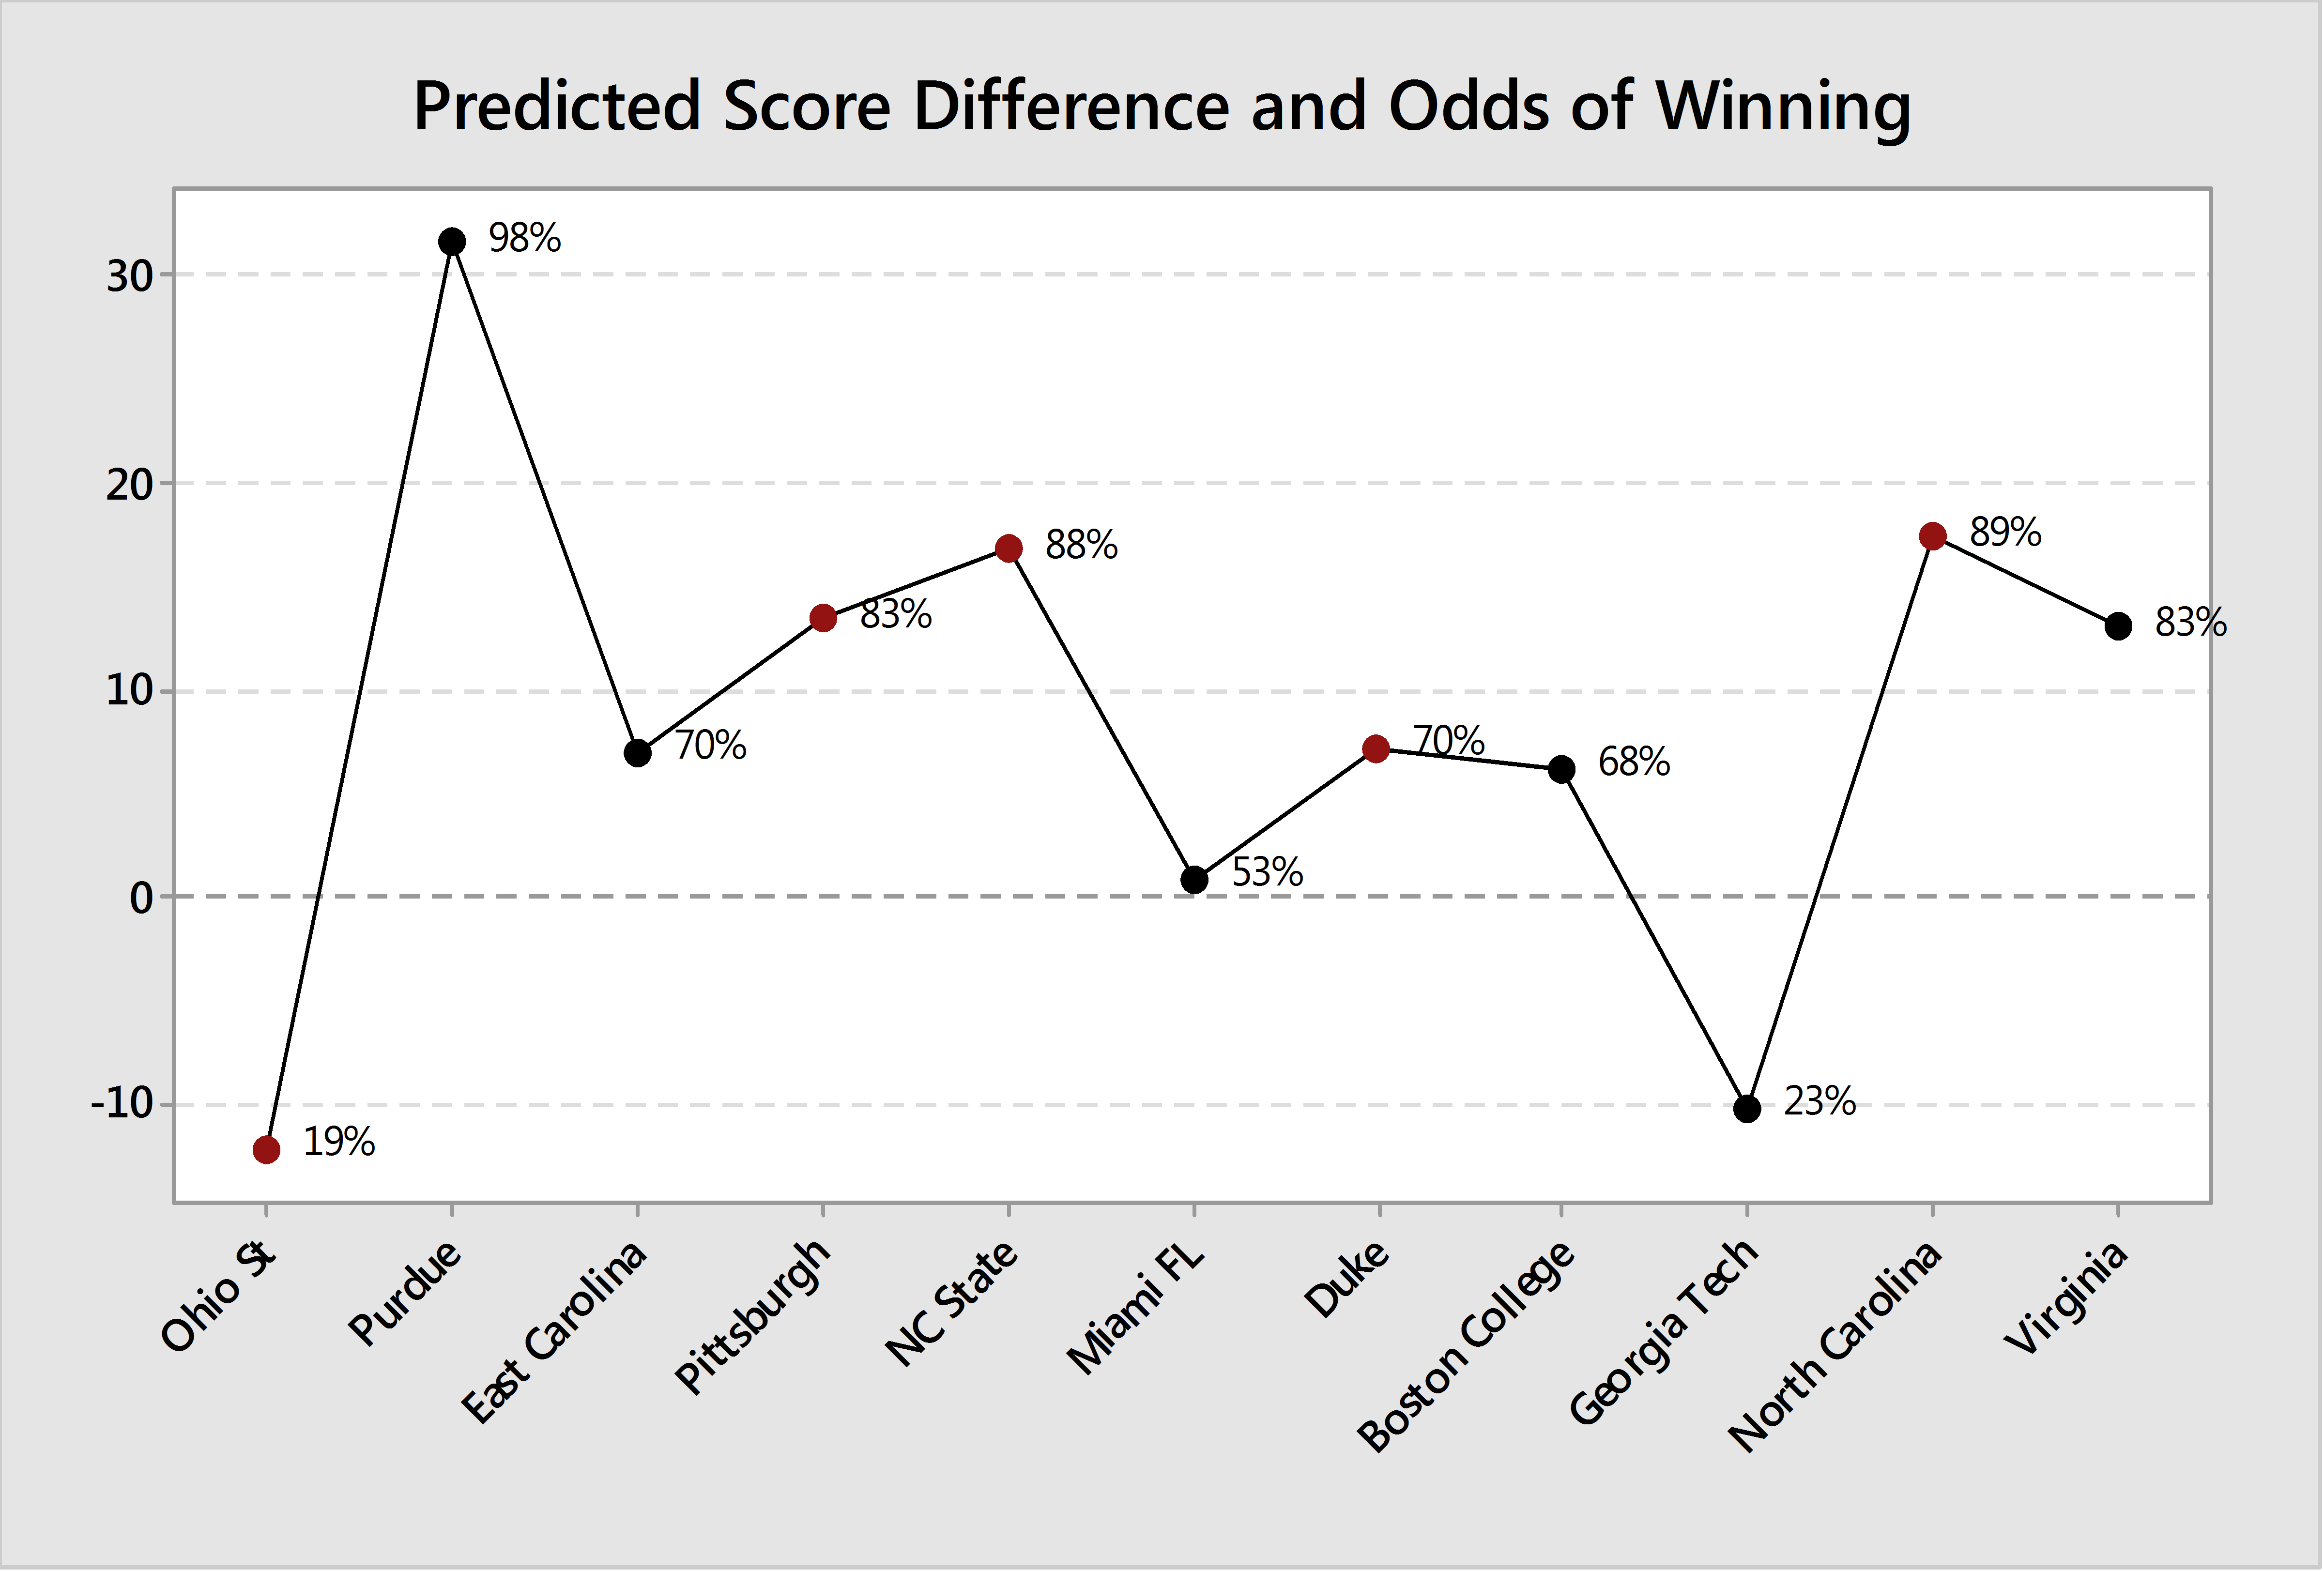
Virginia Tech enters the season as a clear underdog in two contests — Ohio State and Georgia Tech — and a tossup in another, Miami. There are a whole slew of potential heart-breakers between ECU and the ACC slate. Seven games give the Hokies between a 60-90% chance of winning; any one of those individually looks like a probable win, but across all of them you're probably taking 1-3 painful losses. And then there's Purdue — despite recent struggles, it remains surprising to see them at a 2% chance of upsetting the Hokies in their own stadium!
Of course once a few games are played, there will be much better ratings of Tech and their opponents...luckily there will be a statistical preview of every game this season on TKP to keep up with it all.
Returning Production
Much has been made of how much production Tech returns in 2015, and for good reason. Any skill player that scored a touchdown in 2014 is on the roster this season. Before I dive into the numbers though, it's worth remembering that offensive production almost always hinges on the performance of the offensive line. Although we don't have statistics available on individual offensive line production, the team is losing considerable experience. Expectations from the skill players must correlate with what is expected from the offensive line.
Let's look closer at what production returns in 2015, and begin the analysis with rushing totals from 2014:
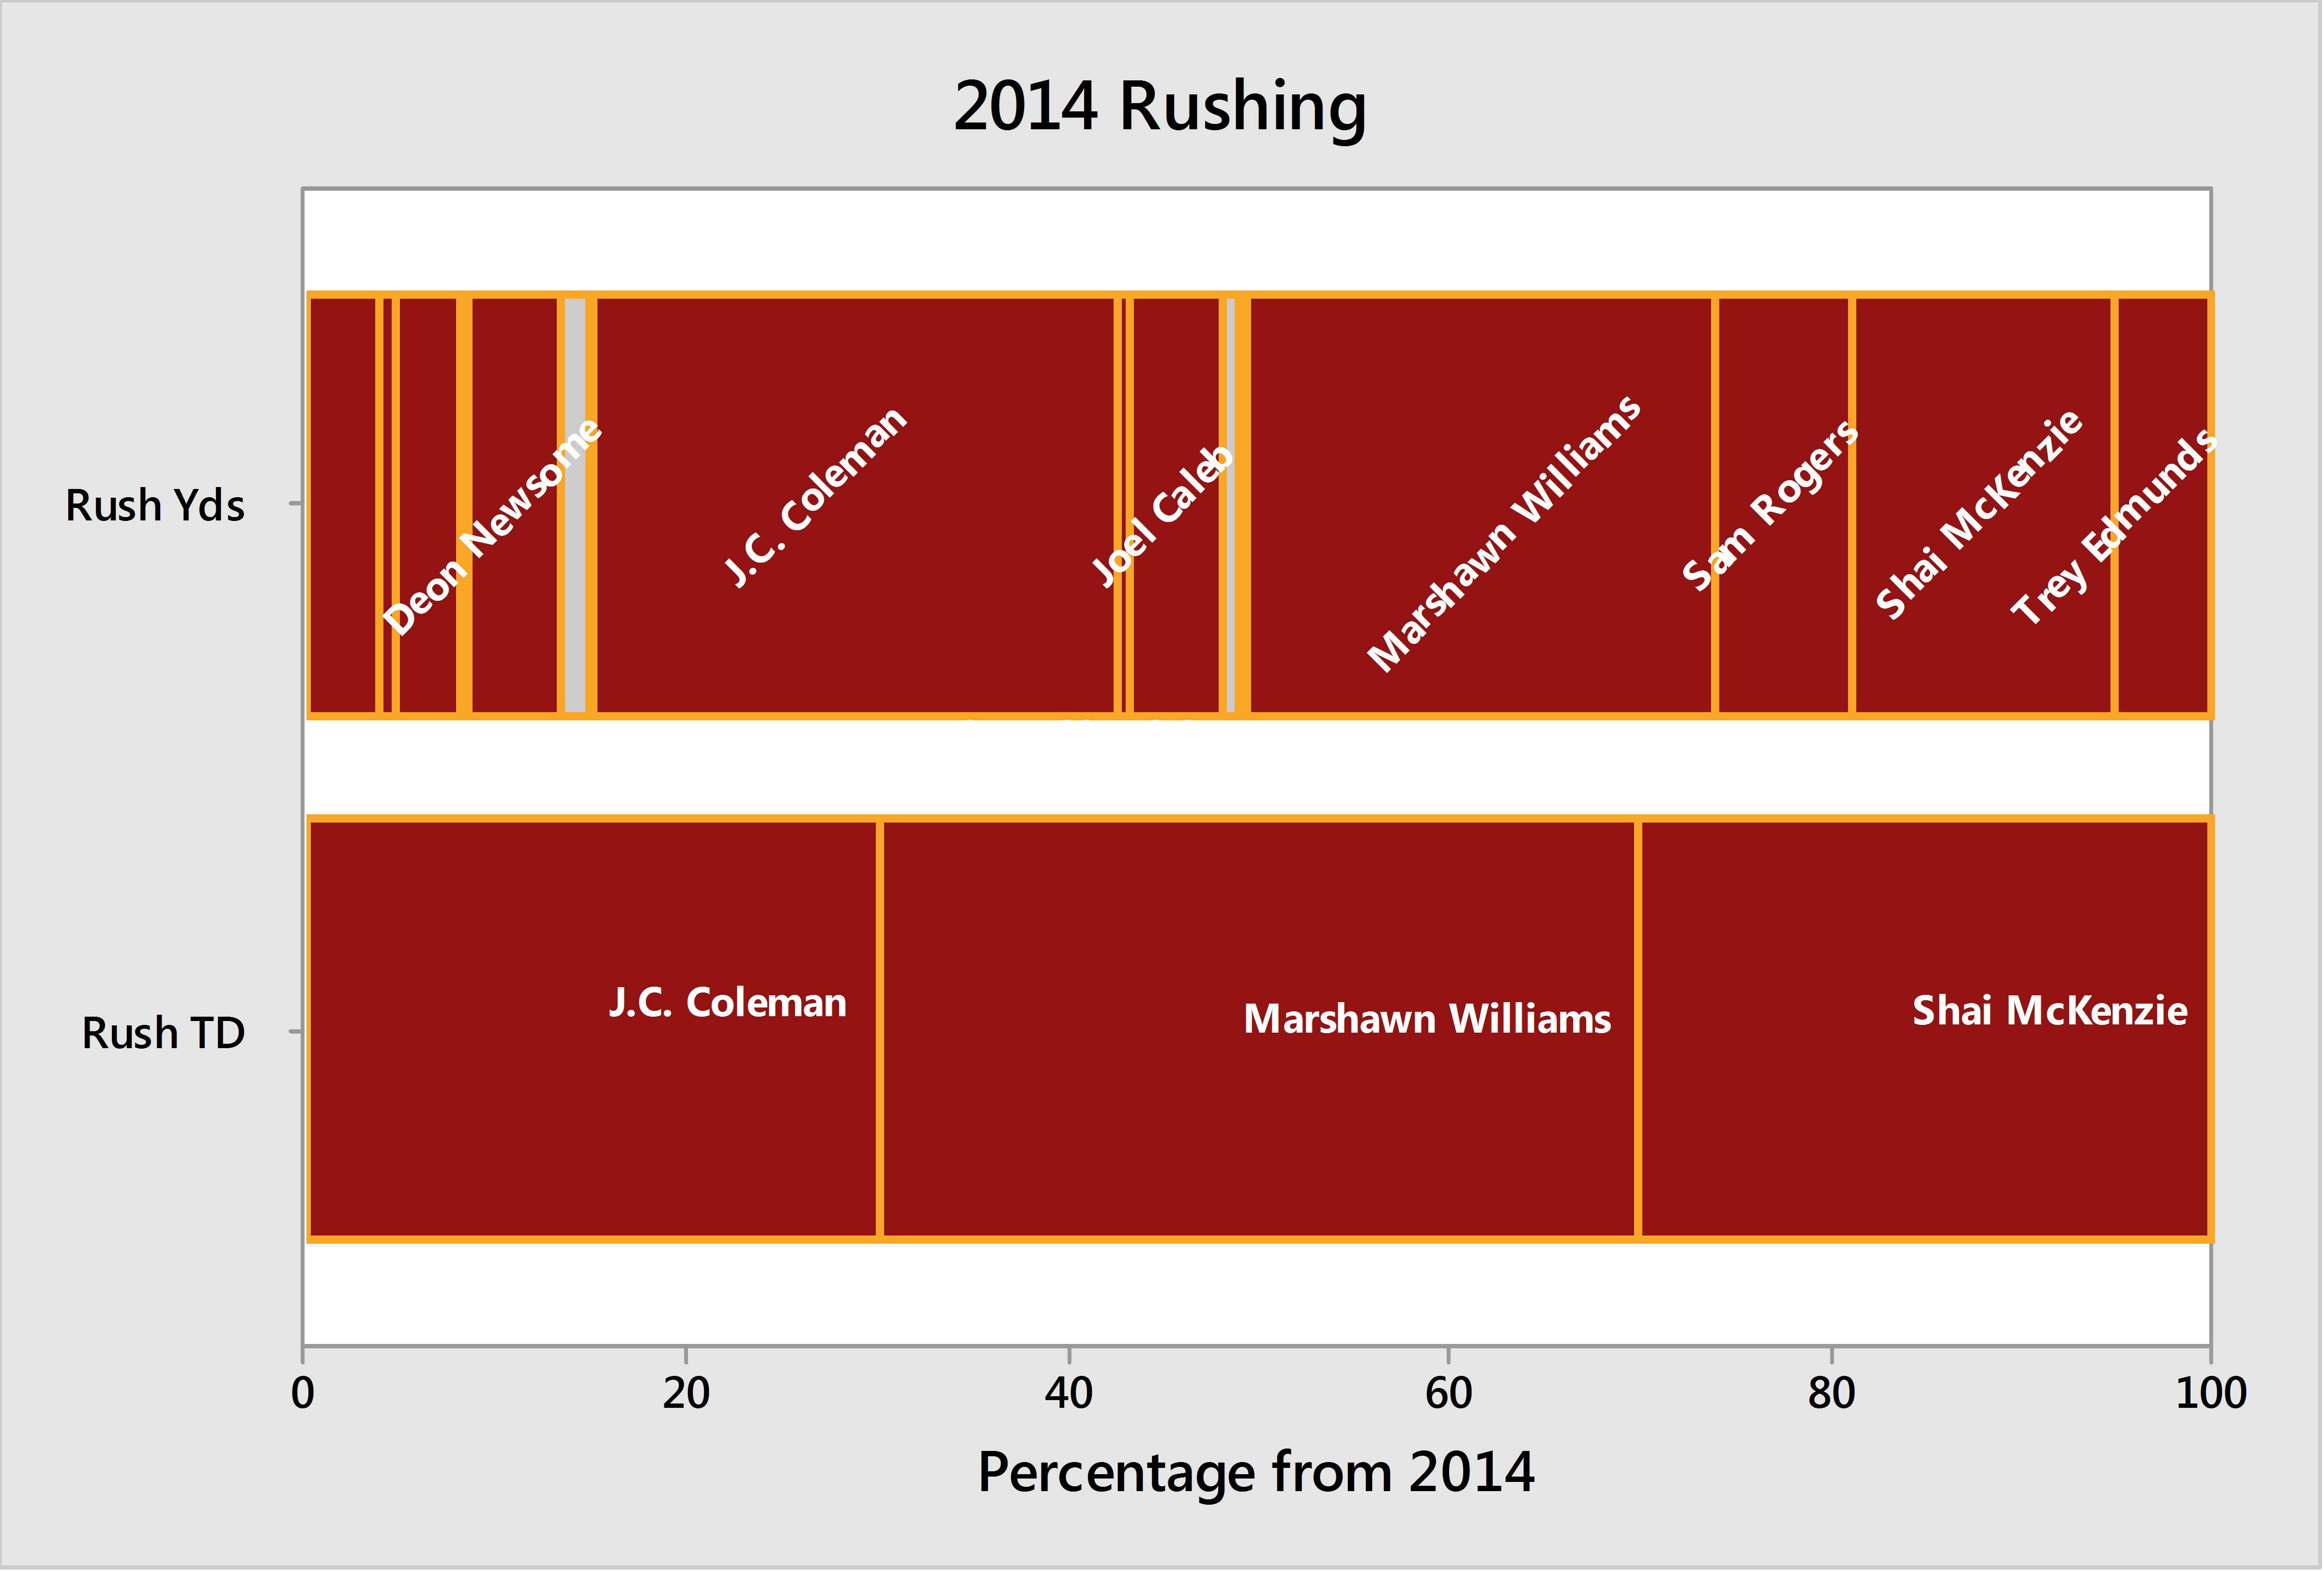
Every touchdown and nearly all of the rushing yardage from 2014 will return for 2015.
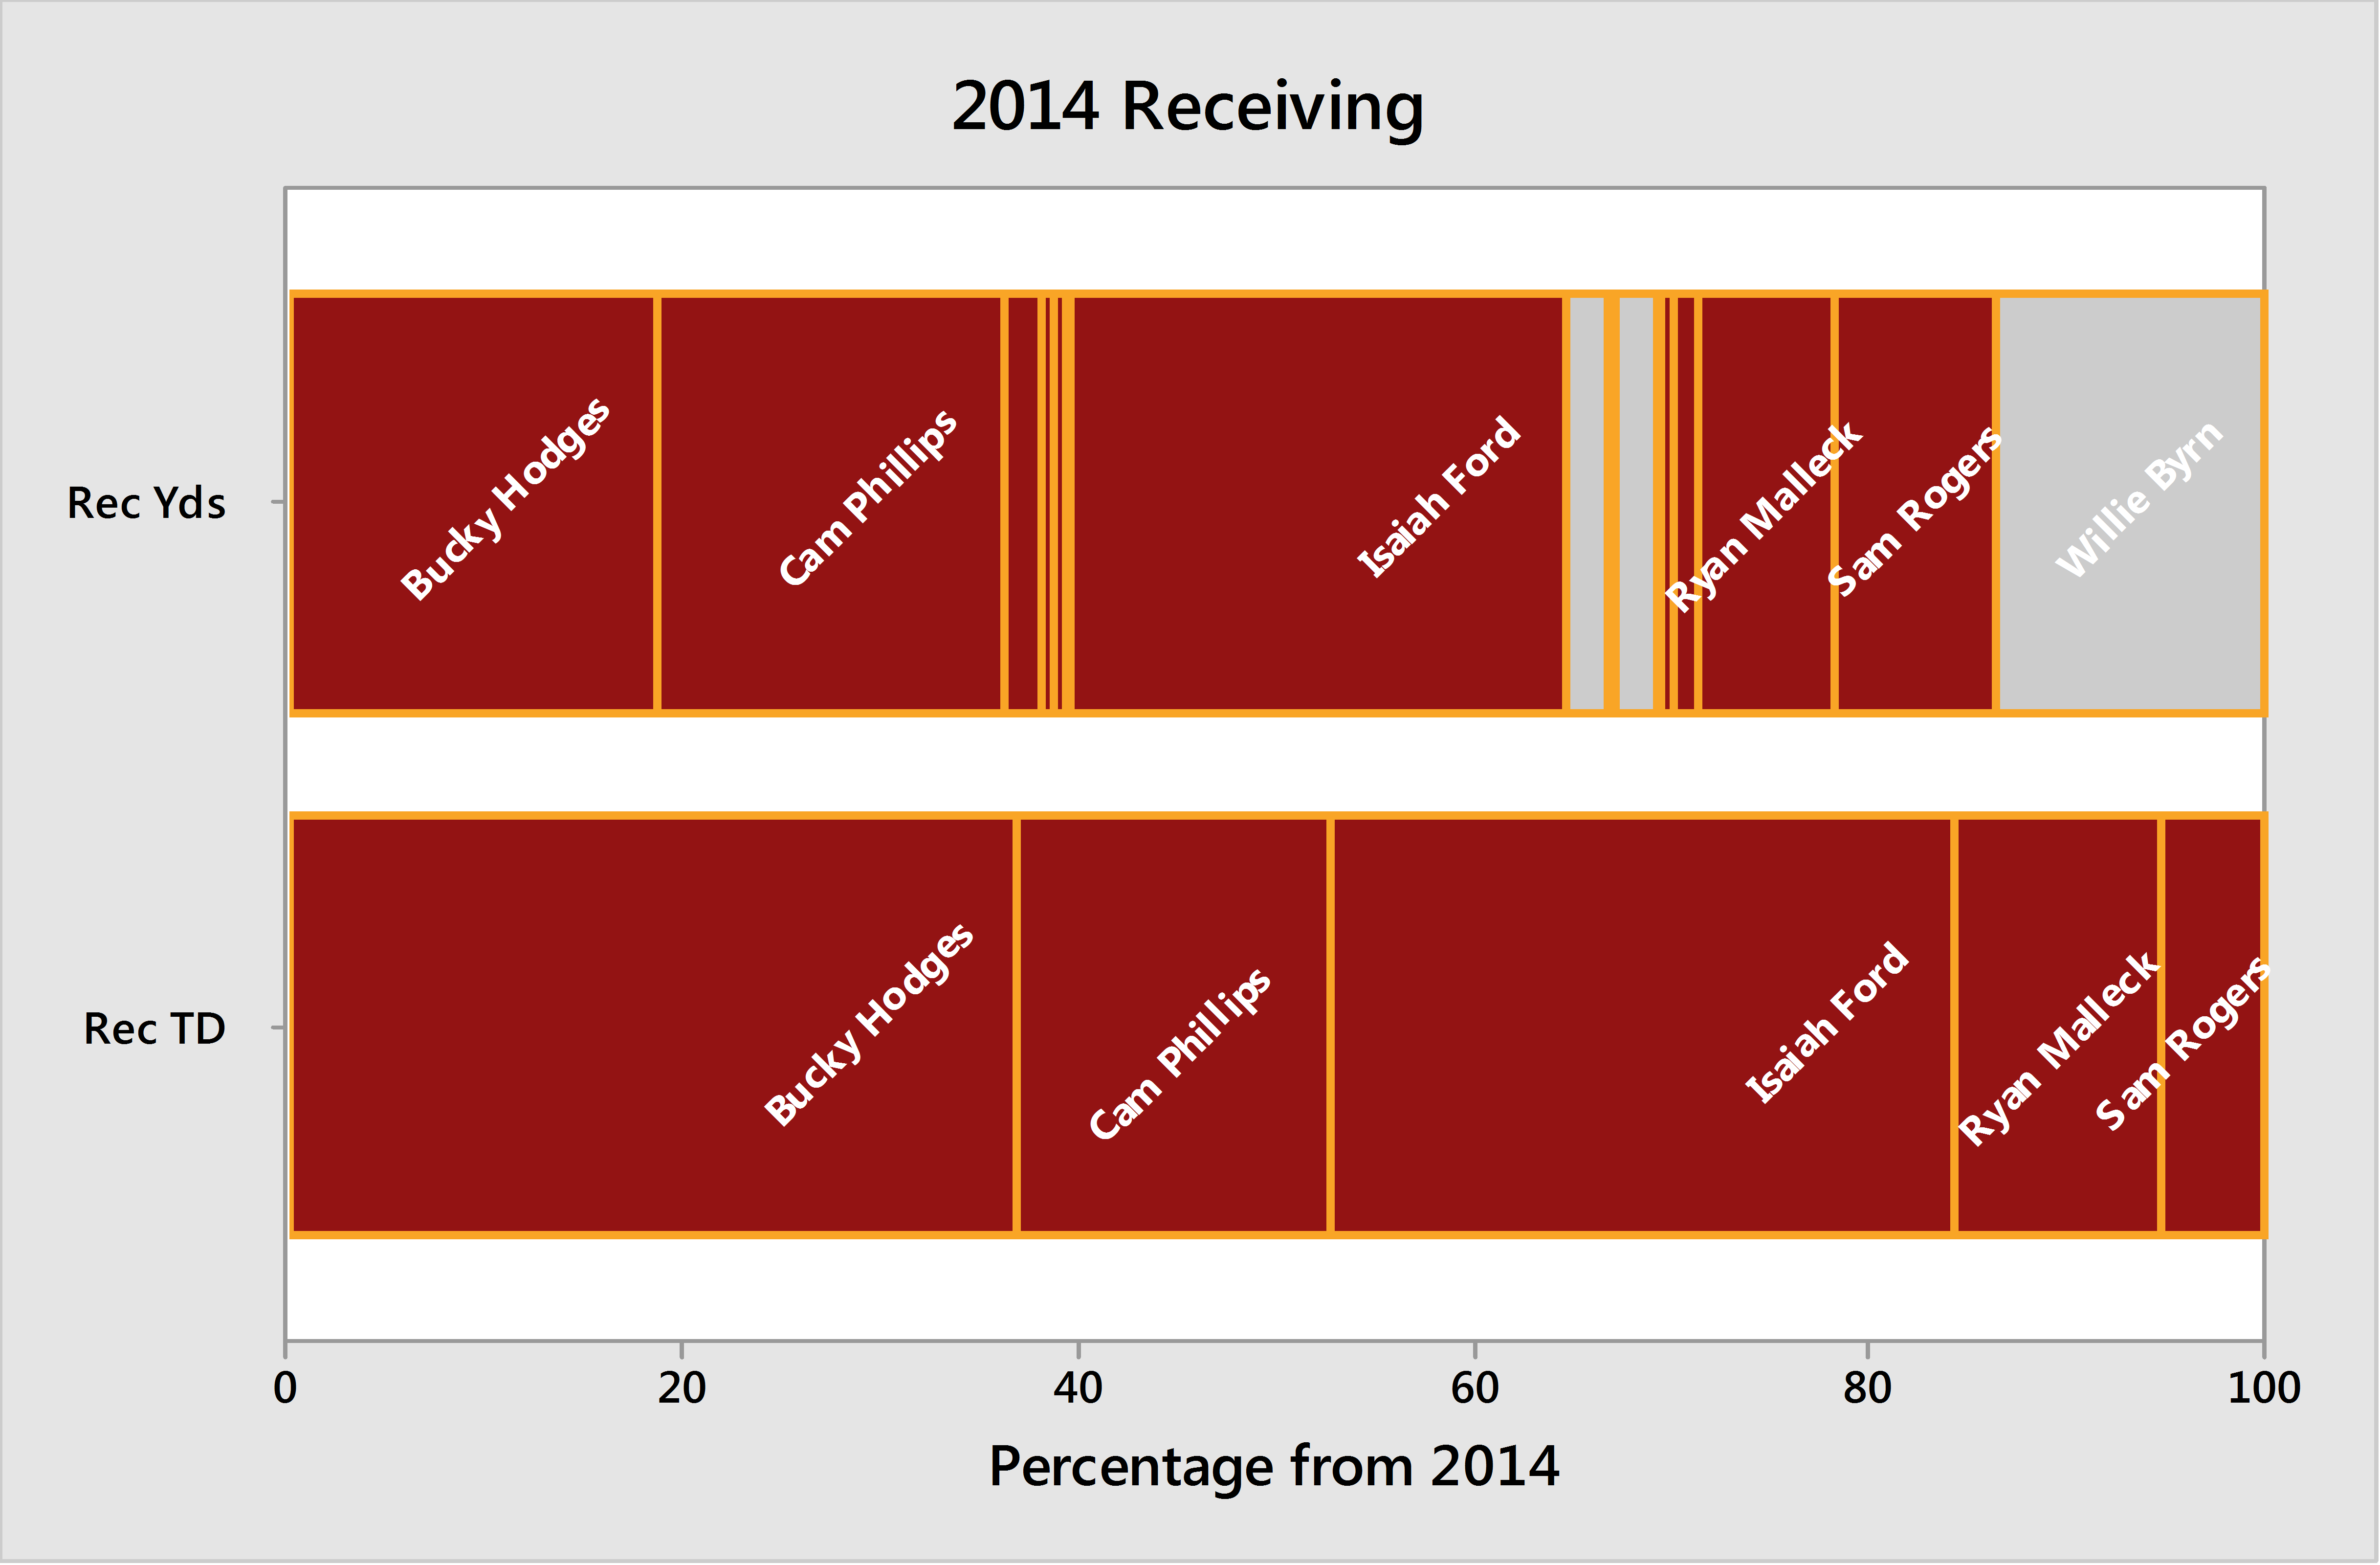
Again every touchdown and almost every yard though the year is back this season. This highlights just how important offensive line play will be: any improvement there will translate to increased production in both rushing a receiving.
Quarterback play will not be graphed as Brewer played the overwhelming majority of snaps in 2014 and will do so in 2015 barring injury or a major step back — the latter of which I do not anticipate.
Turning to the defense, we first examine pass disruption:
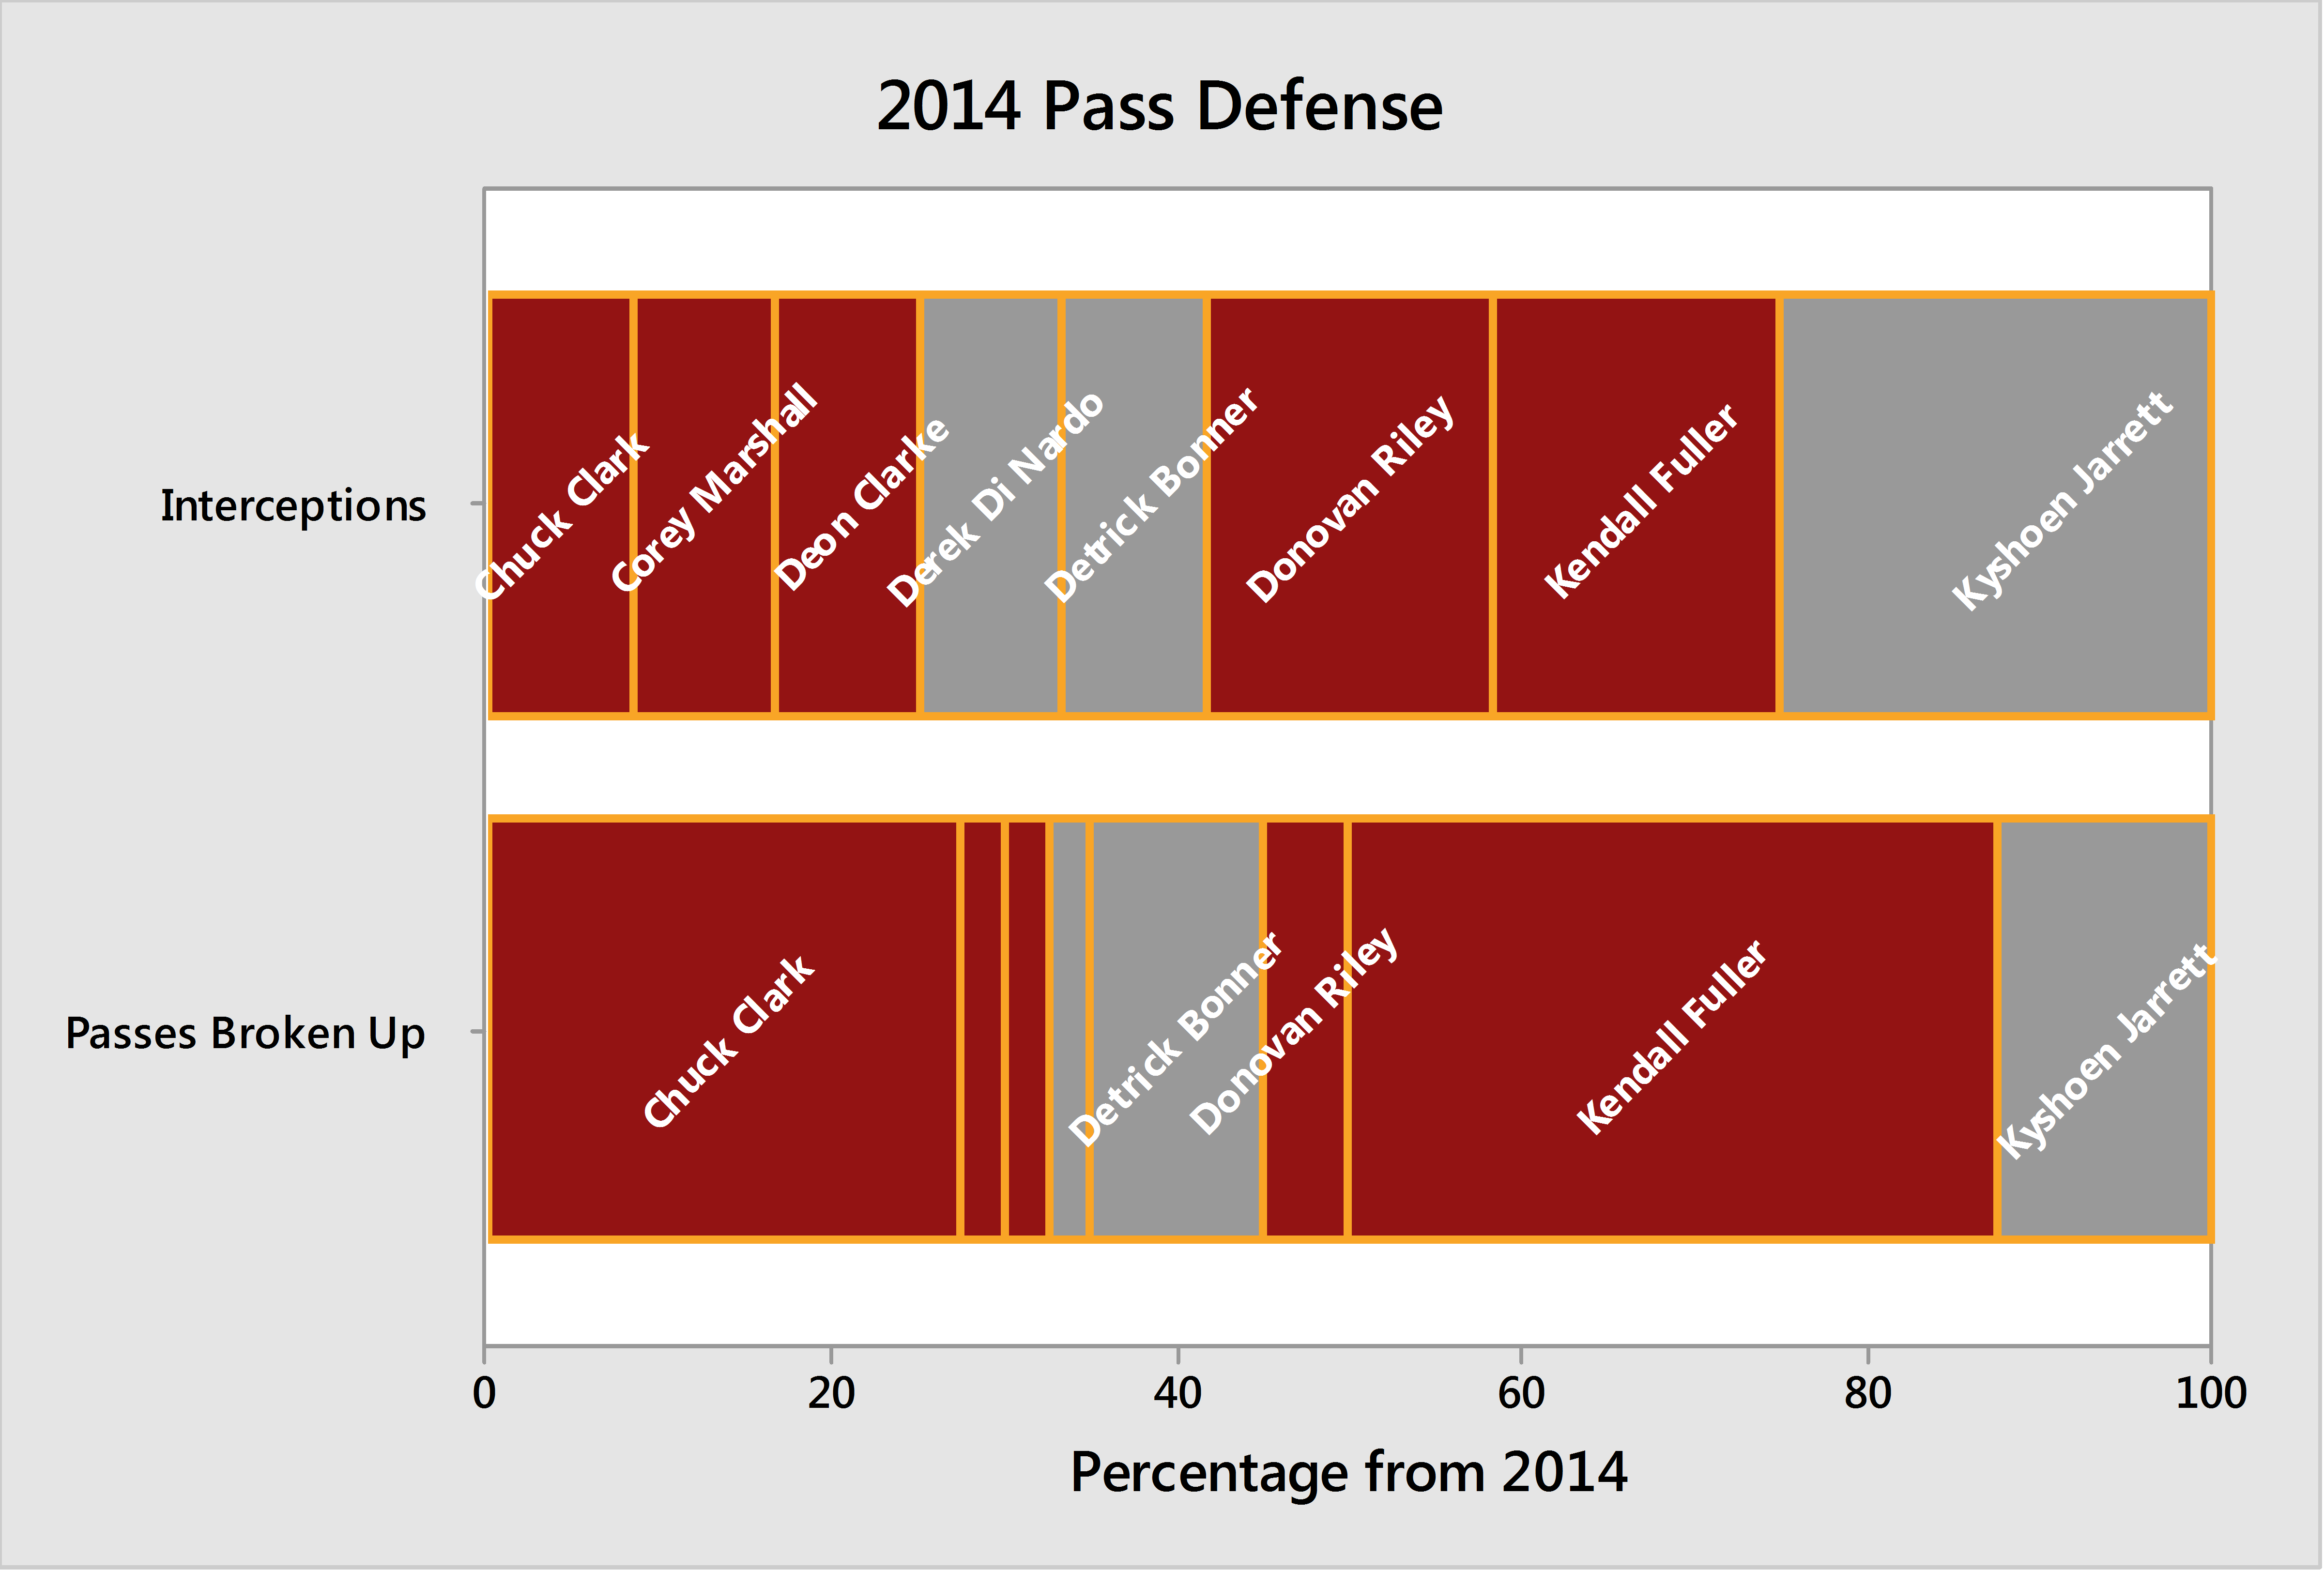
Over half of Tech's interception production returns, and that's a number one would like to see more of. However, most pass breakups are back on the field this season. If there is one area I'm comfortable with Tech replacing production, it is pass defense. The Hokies led the nation by only allowing 47.7% of passes to be completed.
Finally, we examine backfield havoc:
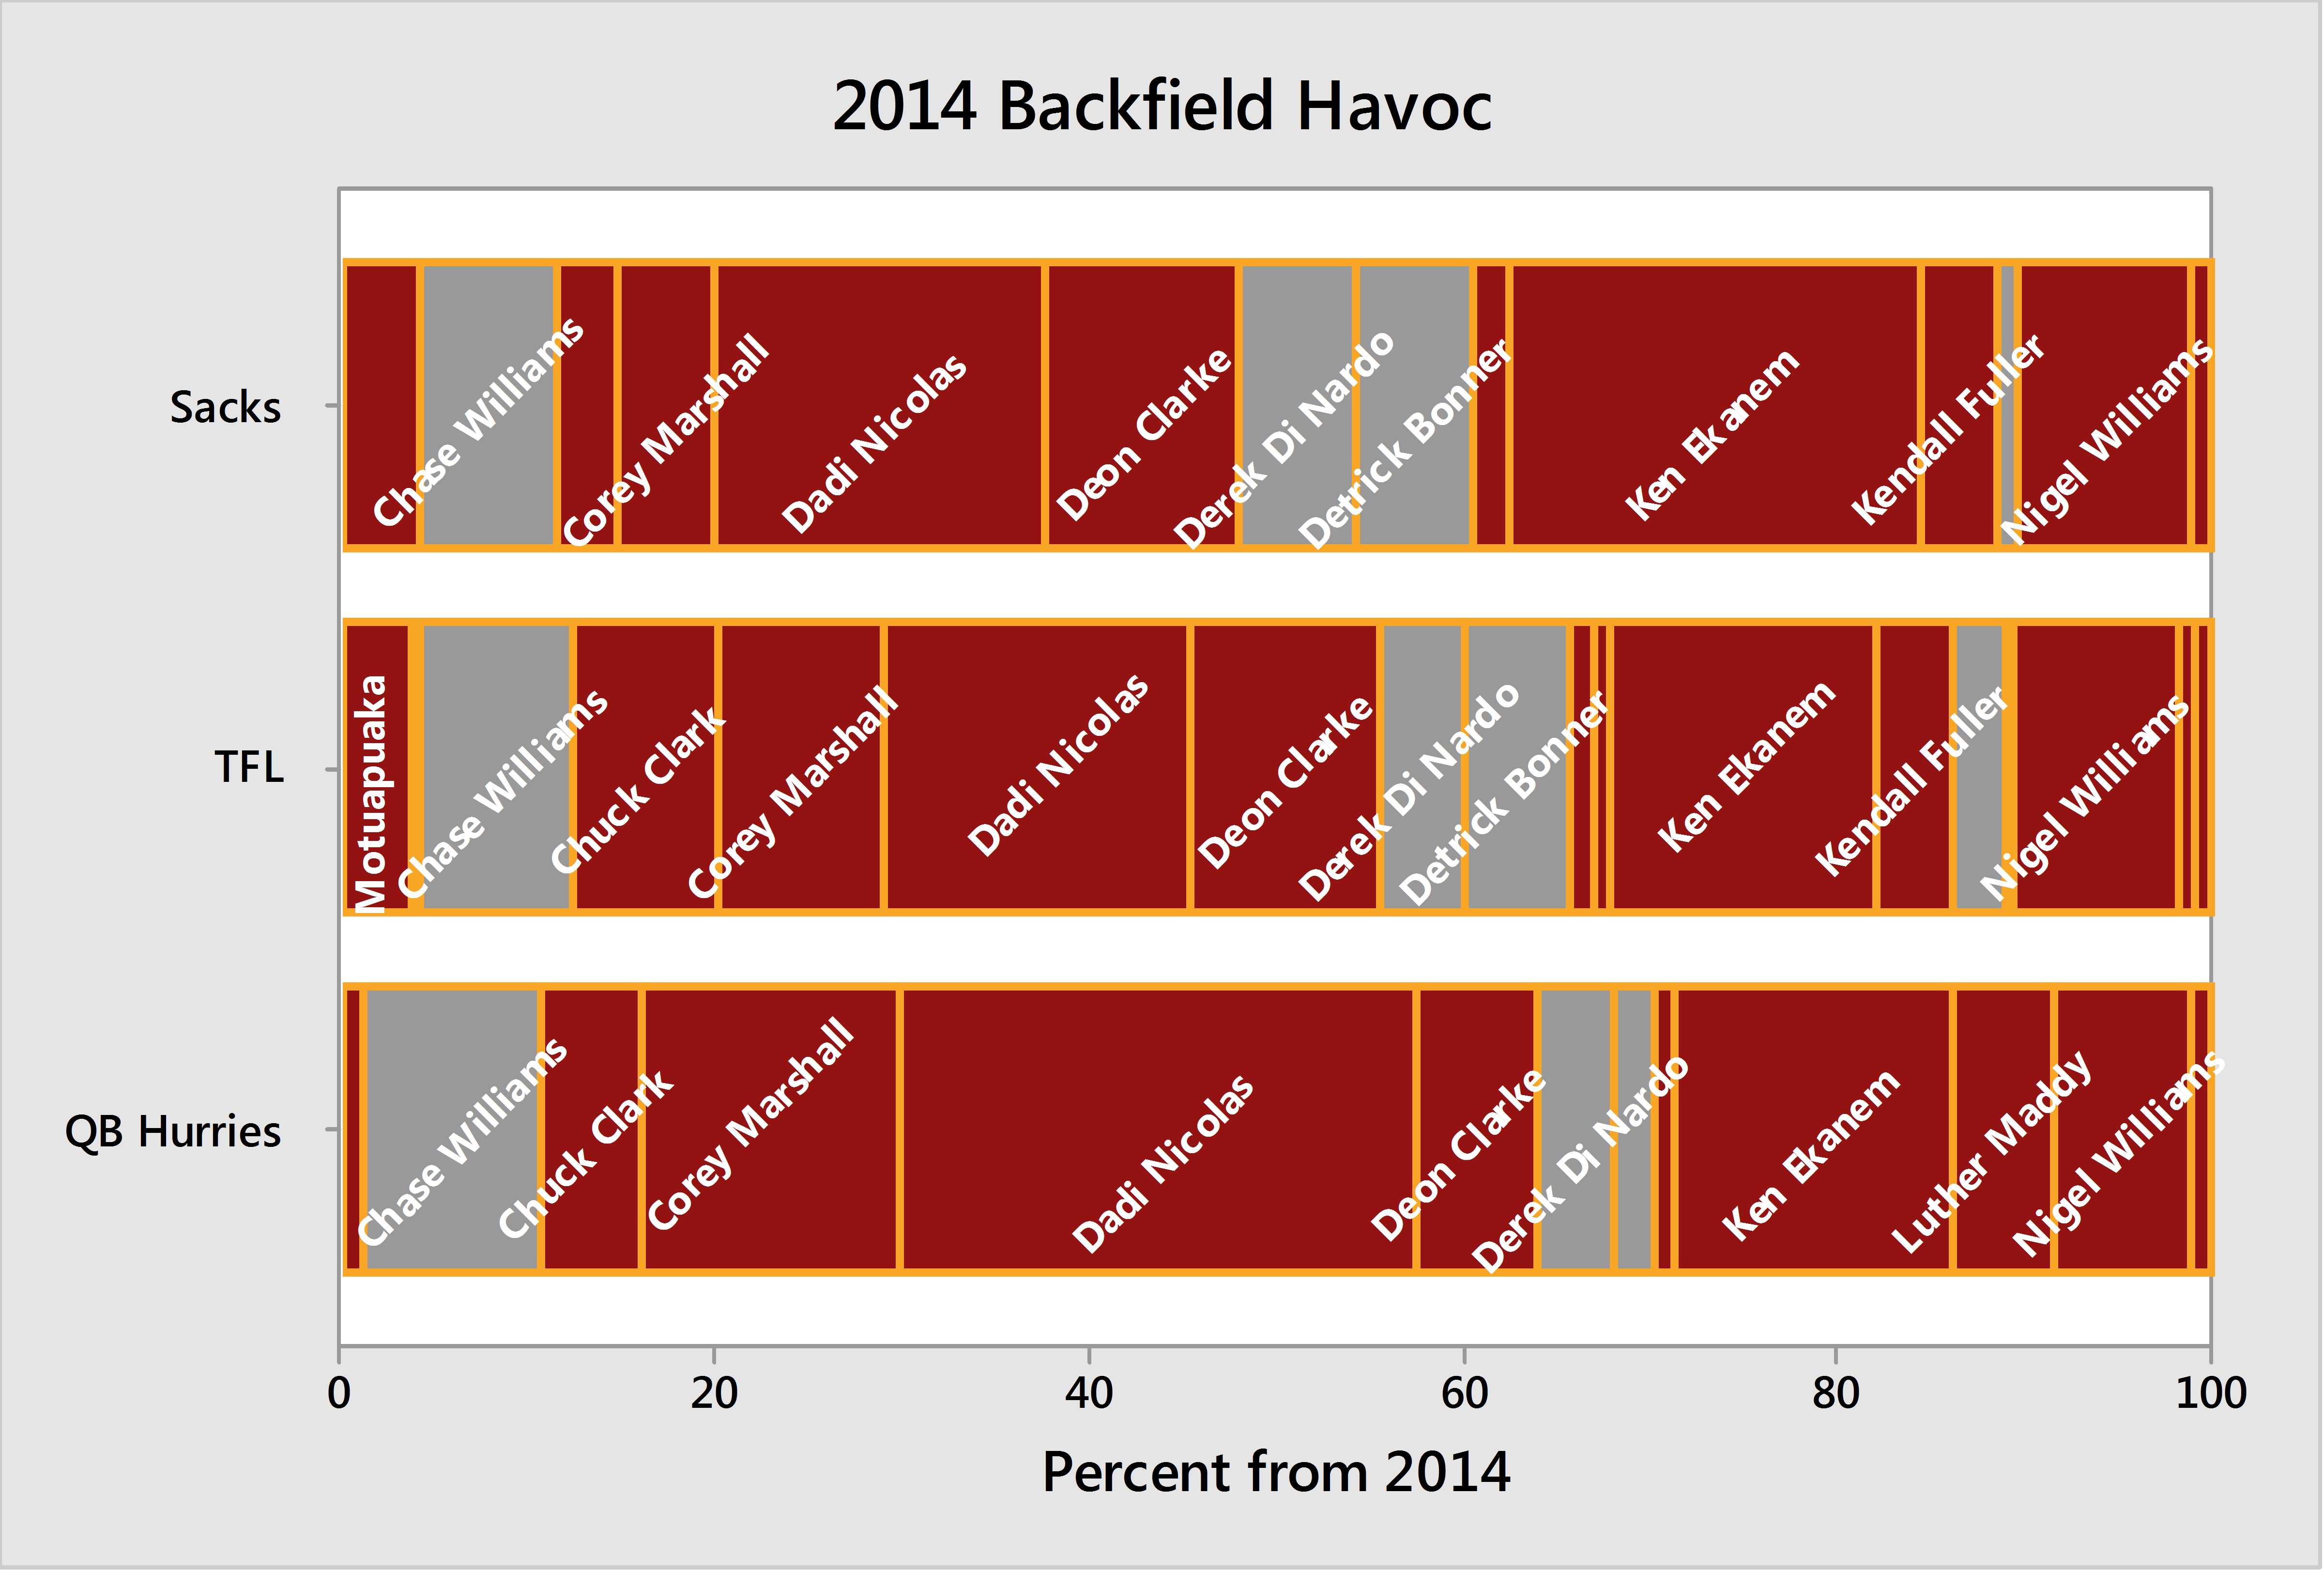
The Sacksburg defense, already infamous for raiding opponents' backfield at will, returns nearly 90% of production in sacks, tackles for loss, and quarterback hurries. This production goes beyond the first string and the defensive line should be able to stay fresh during games. The 2015 defensive line is poised to feast.
Expected Wins
Multiple sources have placed estimates on wins for Virginia Tech in 2015 including casinos, computer predictions, and betting "experts". The predicted totals for each source are:
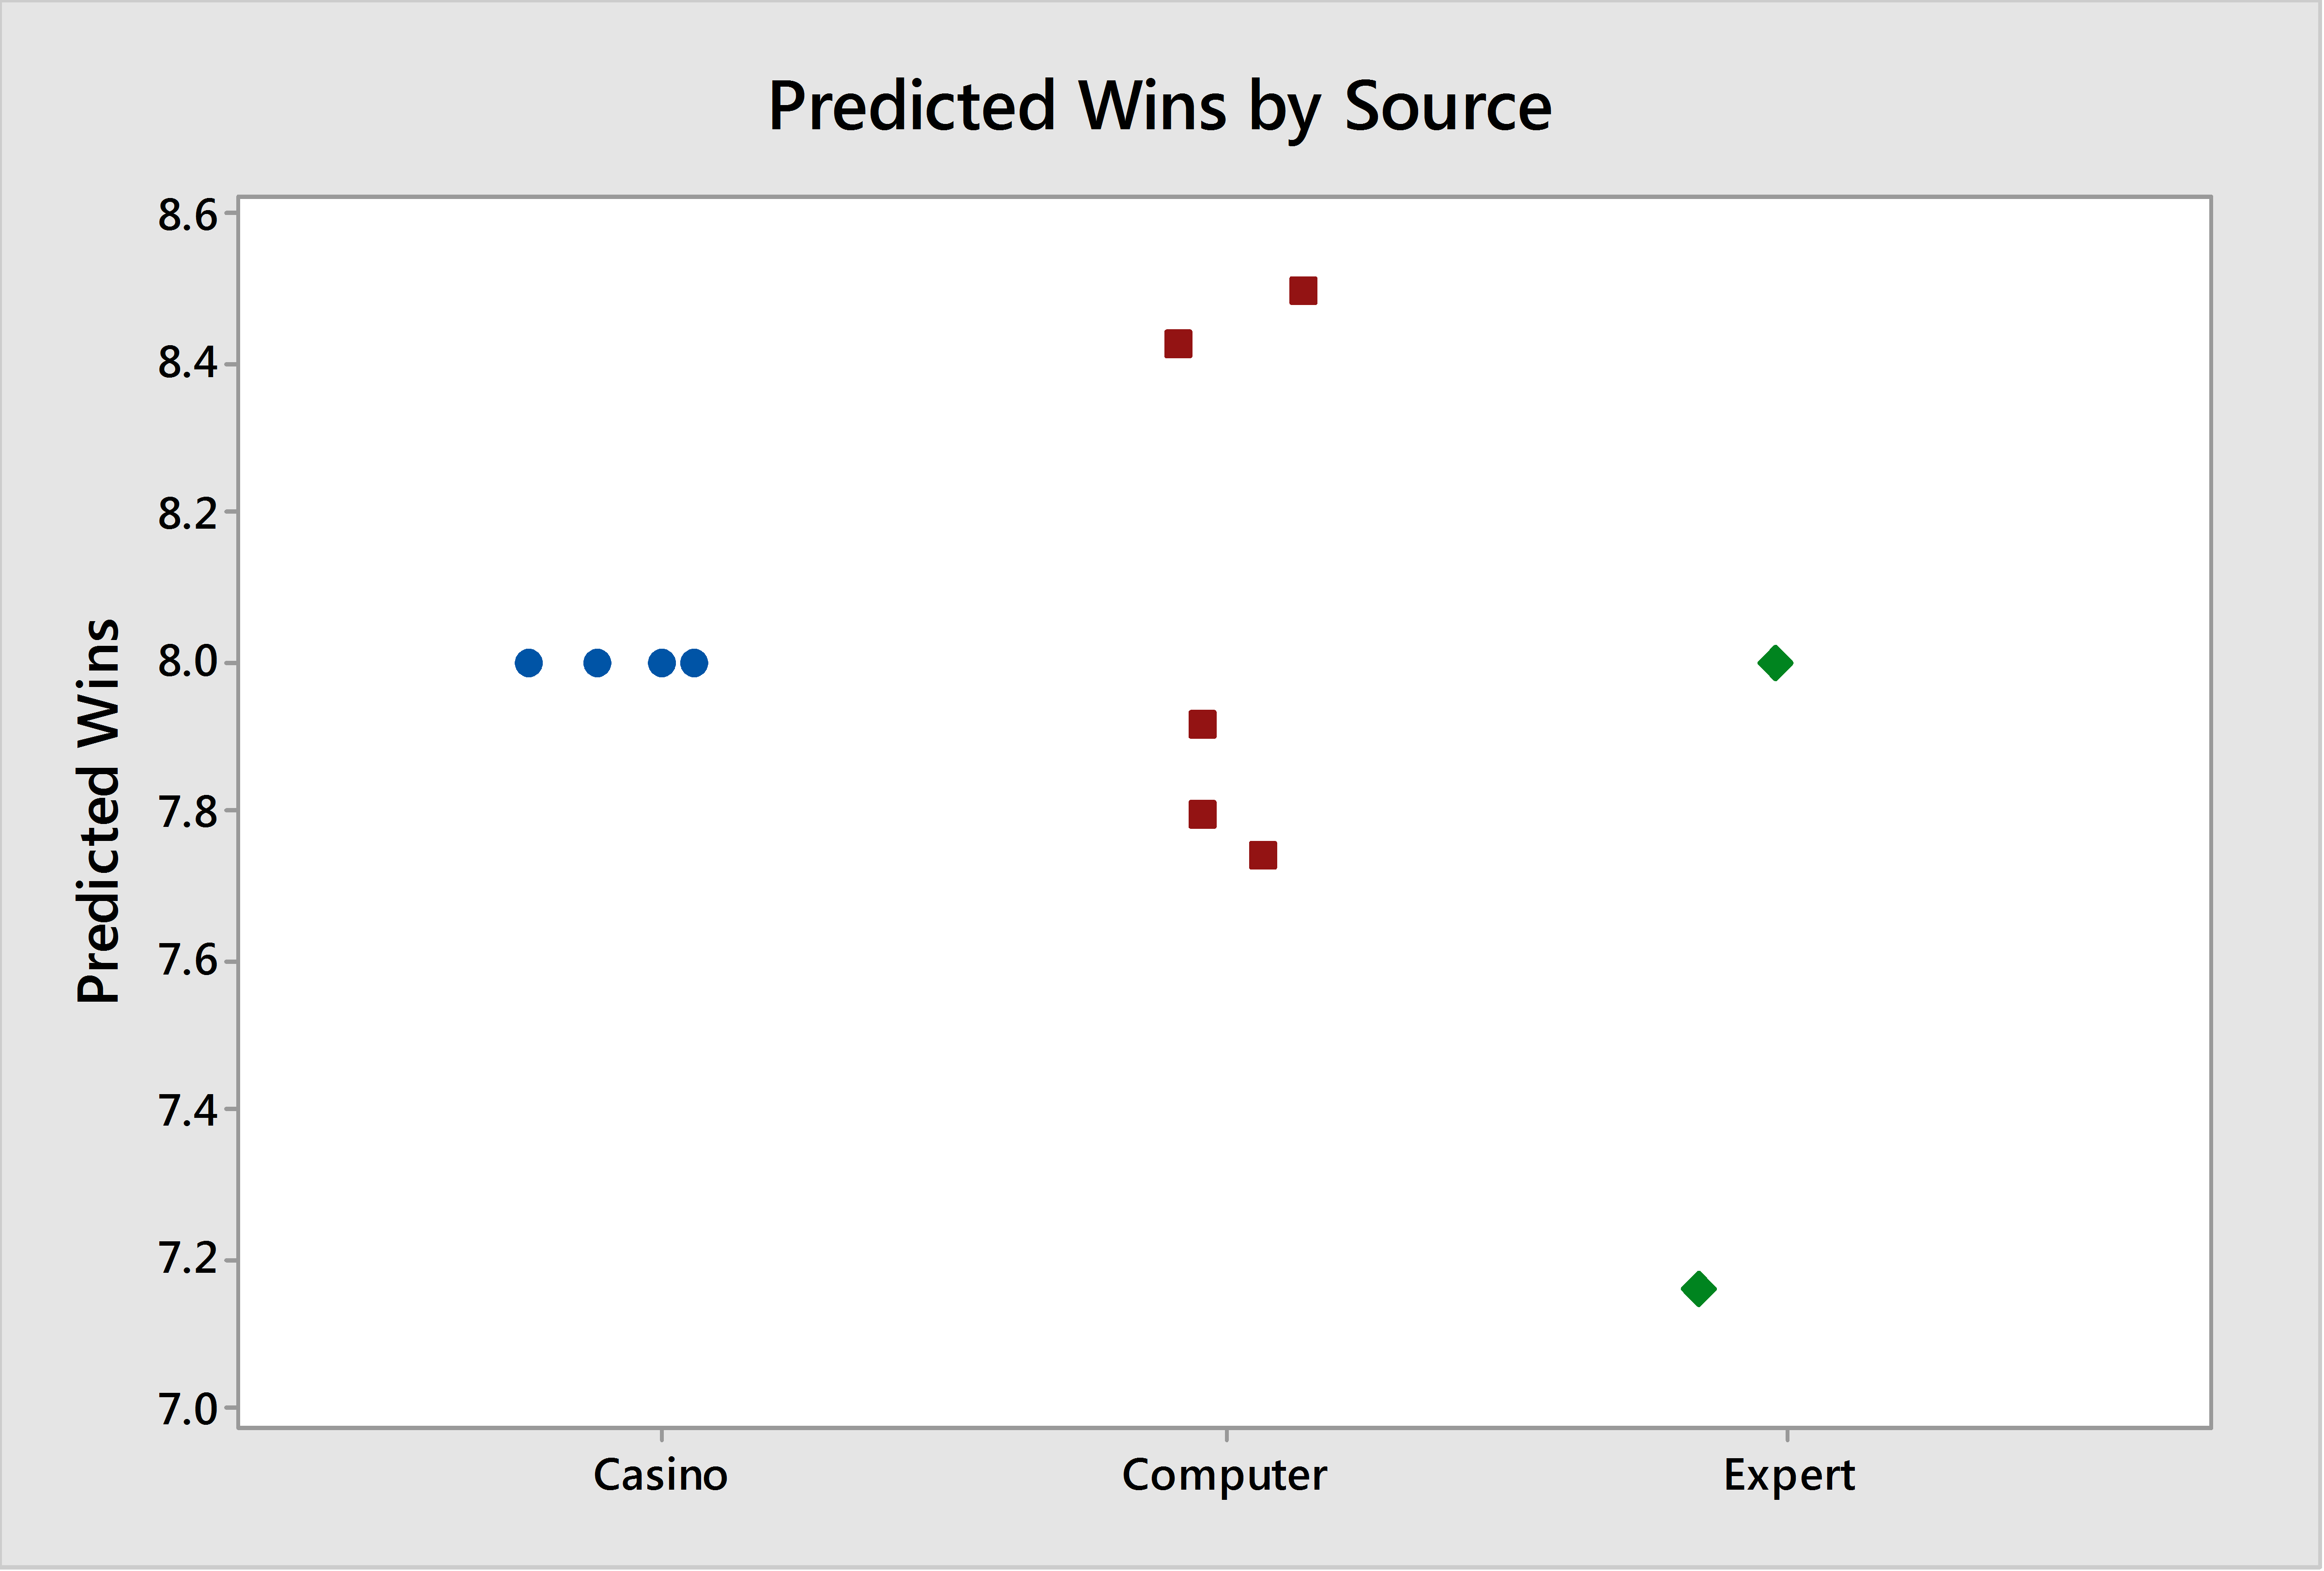
In each case, the casino payouts on 8 wins were uneven such that the true estimate is actually somewhere higher than 8 wins (but likely less than 8.25). Optimism comes easy to fans, but this is a splash of cold water to the face. Both subjective (casinos and experts) and objective sources (computers) see 8-4 as the most likely regular season outcome for Virginia Tech.
What are the odds of each possible win total? Simulating the season 50,000 times produces:
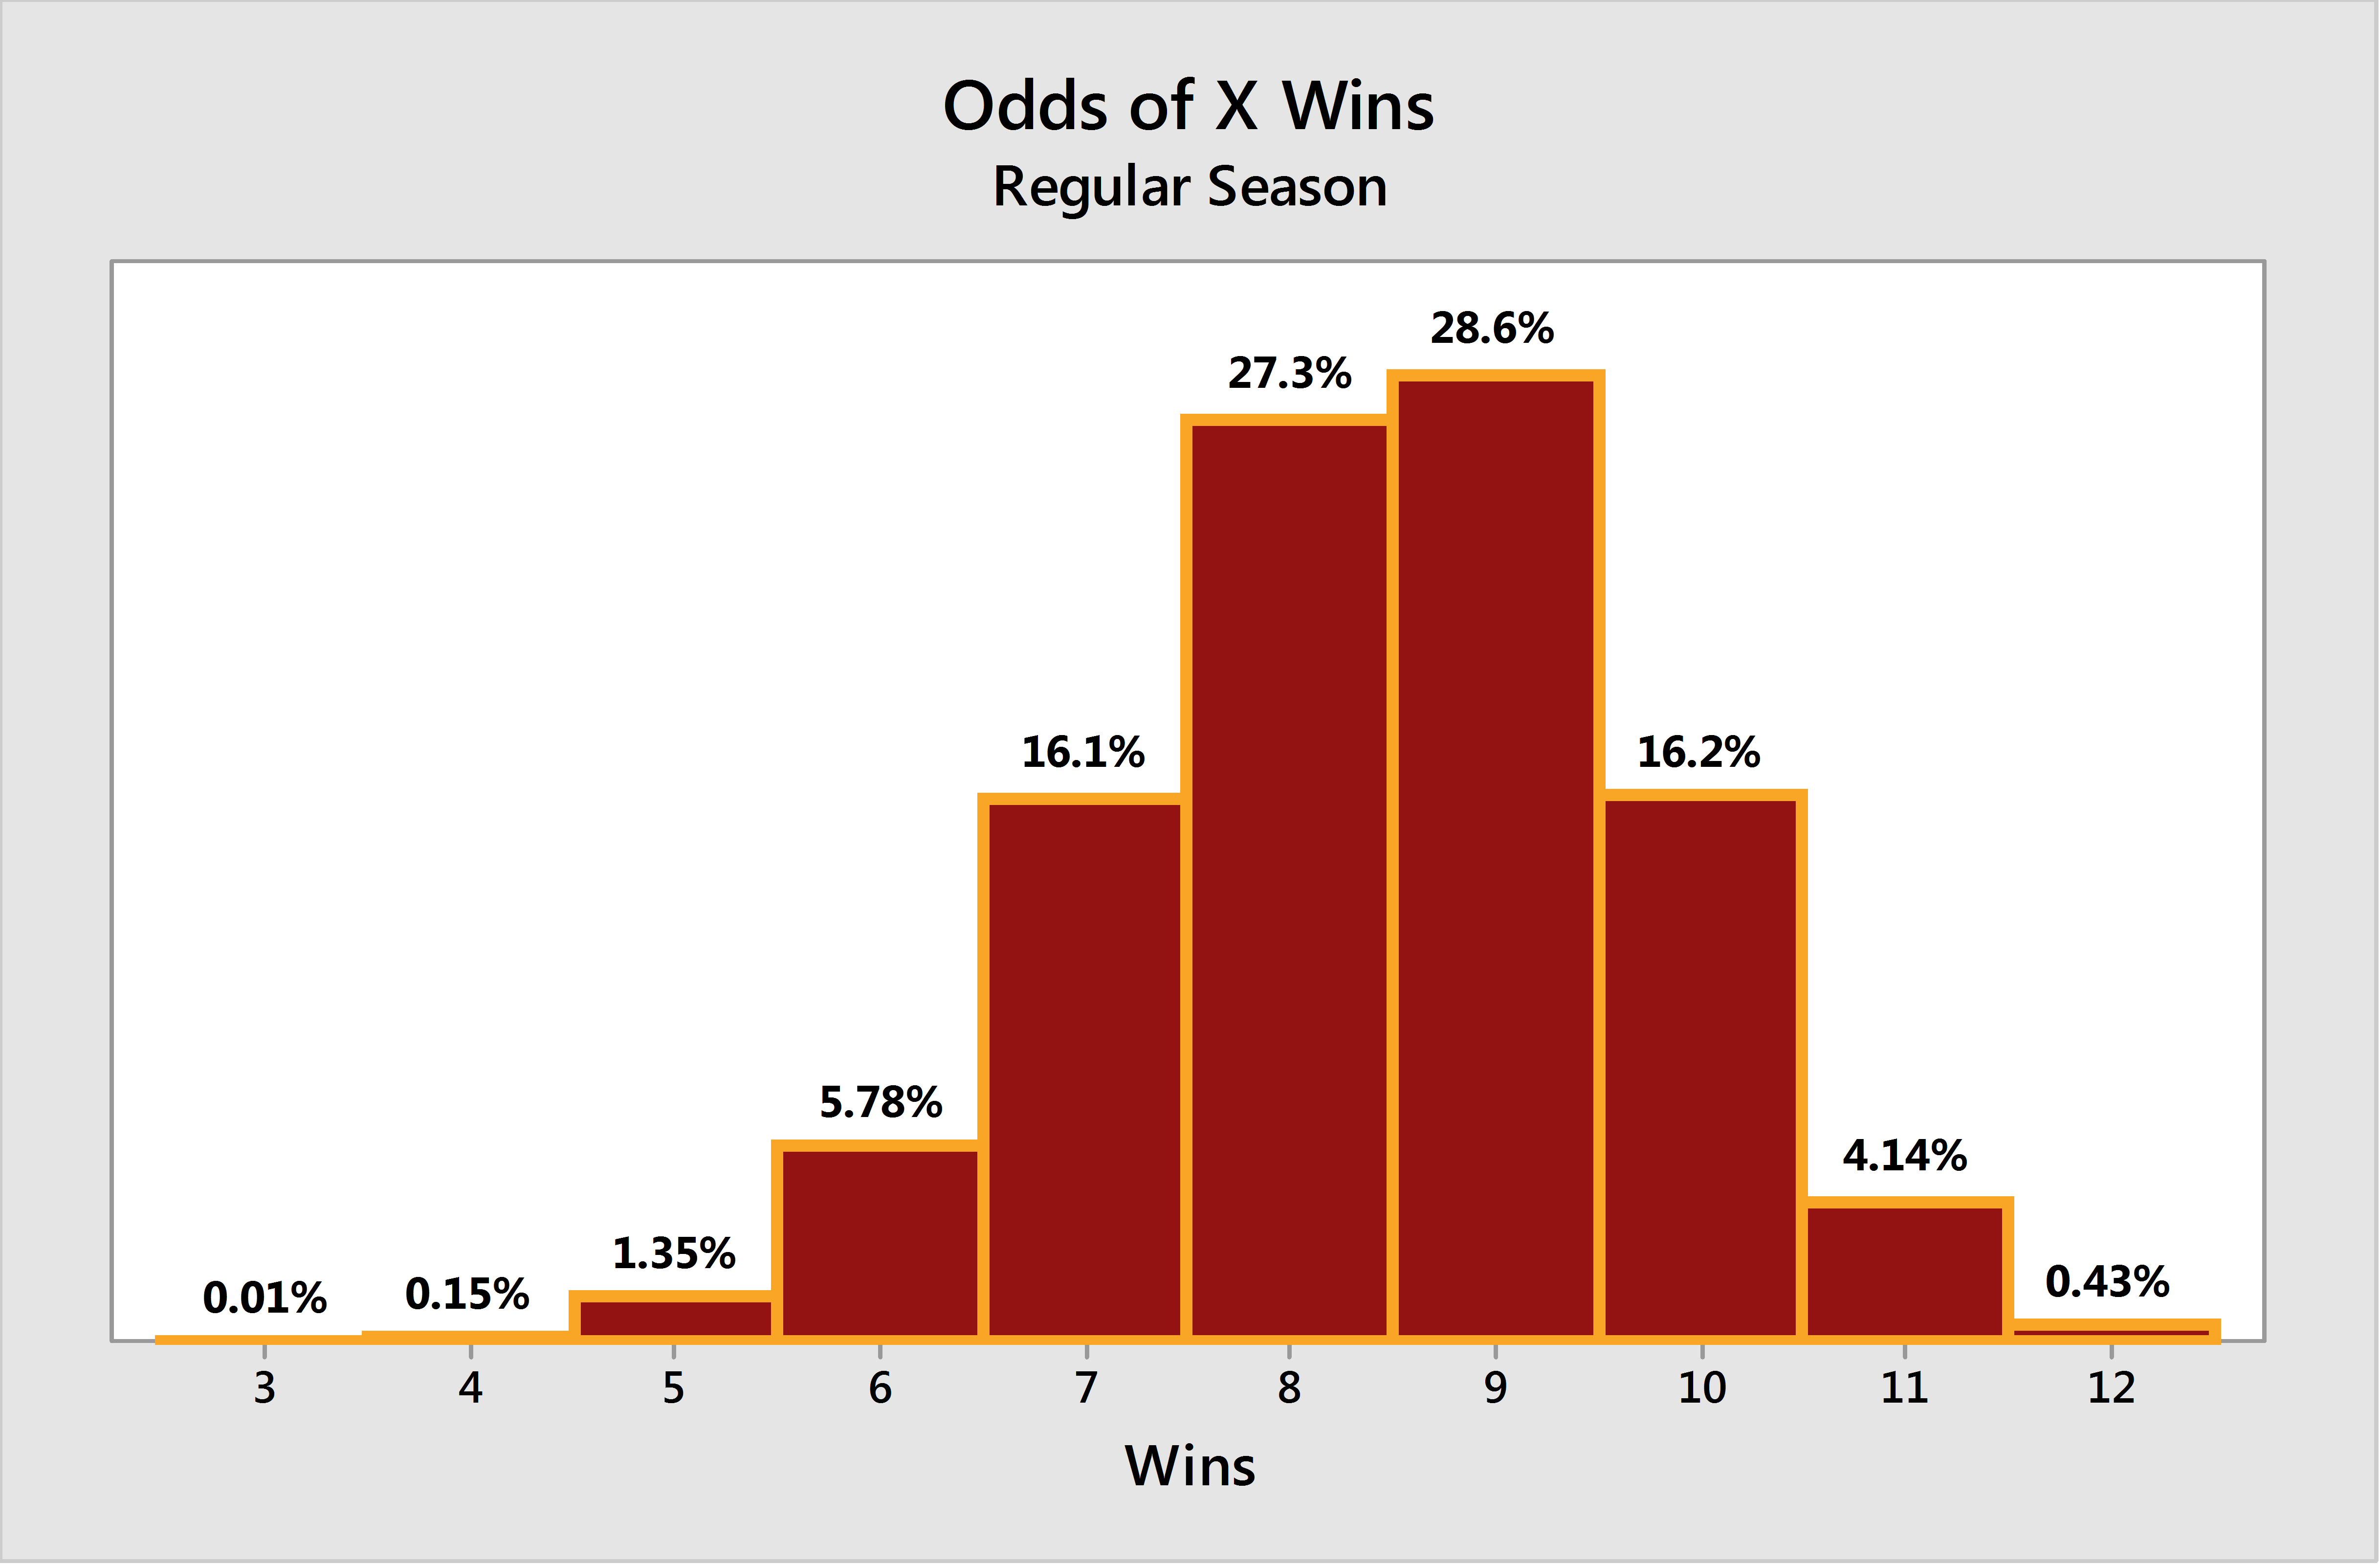
From the simulation results, the Hokies have a 1.5% chance of not being bowl eligible, a 56% chance of either 8 or 9 wins, a nearly 22% chance of a 10-win regular season, and a .43% chance of an undefeated regular season.
What Needs to Improve
If the team is to outperform what computers and casinos expect, improvement is needed in a few areas, mostly on offense:
- Offensive line on runs: Running backs gained 2.77 yards before first contact (90th in the country) and were able to get a first down on 3rd or 4th down and 2 yards or less to go just 61% of the time (108th).
- Allowing sacks in passing situations: On standard downs the team was sacked on 3.8% of plays (41st) but in passing situations that number swelled to 11% (113th). When teams knew the Hokies would throw they were very successful in getting to the quarterback.
- Big plays: The Hokies gave up 78 plays of 20 or more yards (122nd) while on offense the team only created 49 such plays (95th).
- Kickoff returns: The average return by Tech special teams went 19.5 yards, 101st in the country.
- Interceptions: The Hokies were tied for 97th in the country with 15 interceptions thrown, and 86th in interception rate (3.29% of attempts).
Improve those without a corresponding drop off in other areas, and the offense, and team as a whole, stands to make strides and reach the 9-10 win range.
My Forecast
Obviously it is difficult to forecast how things will shake out, especially when what little information we get out of practices mostly consists of 2-second Snapchat clips selectively shared. I'll save my emotions for the TKP season forecast and just go by the numbers and where I think adjustments should be made:
- I'm taking the over on the expected number of wins, and I project a 9-3 regular season record. That's based on Michael Brewer's development (along with Isaiah Ford and Cam Phillips) now that Brewer has had time practicing with the team. I will not cite injuries because that is part of football. Every team had injuries last year, and will have some this year.
- I'm estimating a slight improvement in offensive line play based on reports of Gallo looking good in practice and frankly not much room to get any worse.
- I predict a small-to-modest reduction in interceptions to somewhere in the 10-12 range. Many of those from last year cannot be blamed on the offensive line or receivers and rather were bad decisions — something I expect will still occasionally occur.
- The team will perform better on offense, but will still disappoint the fans who remember the Tyrod Taylor-led offense averaging 34 points a game in 2010. However, the improvement should allow the defense more rest and result in better field position and pay off on both sides of the ball.
- Isaiah Ford will not become the first VT 1000-yard receiver. Not only will the ball get spread around, especially to tight ends, but it is difficult to see the offensive line performing well enough, and Brewer throwing deep routes accurately enough, to create the kinds of explosive pass plays that tend to produce 1,000-yard college receivers. Ford has the talent but the circumstances aren't there.
Thanks to cfbstats.com, Football Outsiders, and masseyratings.com for providing the data for this article.

Comments
I really appreciate the analytics. I've even shared this link with family and friends of other schools, I'm that impressed. Thx brother!
We're going 12-0!
j/k great analysis. Frankly I'd be happy with 9-3 as long as we beat the boo-hoos.
Was Furman left out for being FCS?
Which would have a lower percentage of winning against us, Furman or Purdue?
Yes - most computer rankings leave out FCS teams so there was no projected score difference.
Sagarin, however, does include them and has Purdue about 16 points better on a neutral field. So realistically we should be even more heavily favored against Furman than Purdue if all else was equal (for the record I think after weeks 1 and 2 that Purdue percentage will come down some). Of course not all is equal as we're playing Furman 5 days after a huge Labor Day matchup against an elite team and we'll just leave it at that without any historical context and try to focus on the upcoming season and not any past seasons. Think happy thoughts, think happy thoughts, think...
0.43%? I like those odds:

Well, statistically, if you assume each game is independent of the previous game, there is a ~0.408% chance we go undefeated in the regular season.
That's if you assume there is zero chance of losing to Furman. If you account for the slim possibility that we lose that one (not that such a thing is concievable. I'ts never happened before, right?), the likelihood goes down slightly. I used 98% chance that we beat the Vermin and got 0.400% chance of 12-0.
I think we're reading a little too much certainty into the individual game probabilities...let's all agree it's greater than 0% and most likely less than 1%. If we beat Ohio State let's shift it to between 96 and 98%.
Don't forget this is a board full of football junkies with a lot of engineers. We take numbers seriously.
Otherwise, i'm in full agreement with this statement.
We have better odds at a 12-0 season than a 4-8 season. That's all I need to know.

said Mike London, never
You had me at Scrubs...

78 big plays surrendered last year. During the ecu game it felt like they got that many in the first quarter
Good stuff. What stuck out to me was the horrific stats on running the football. I expect to see a significant improvement there this year. Some overall thoughts:
1. We can't be much worse running the ball, but I expect we will improve considerably. Look for VT to finish in the top 4 in rushing in the ACC. Still no 1,000 yard rusher, but two guys over 700 and playmakers 4 deep.
2. Brewer is what he is, his problems last year weren't about lack of preparation in the summer. He's a risk taker and will continue to be so. But that gunslinger mentality is also his benefit: last year, when he didn't throw picks, we lost. He had 15 interceptions last year, he will have 10+ this year.
3. As good as our defense is, offenses are just ahead these days. Last year, we gave up >20points 7 times (and Cincy scored 17 while snapping the ball to the equivalent of their punter for half the game). Lots of good offenses on our schedule, look for our offense to need to get to 24 points to win those close games.
Brewer's INTs were partly not being on the same page. There were some horrible throws and there were some where the WR did not run the right route and the WR wasn't there or Brewer tried to make something happen even with the wrong route. I expect him to do better this year.
There are good, average and bad INTs.
The good ones happen 40 yds downfield and the DB's progress is stopped there; same as a punt without the chance of something going wrong on 4th down. They're actually not that bad if thrown early in the game, because it re-enforces your deep threat potential, hopefully softening coverage underneith. (Think Brewer in 1st qrtr of OSU game.)
The average INTs are 10 yds, over the middle, with little or no return. These end your scoring chance and may give them good field position.
The bad INTs are the ones taken back for scores, usually thrown outside the hash marks. Worse yet if they're thrown late in the game. (Think Brewer vs GT or Logan vs BC.)
We need more good INTs and less bad INTs. The best way to do this is better line protection and more aggressive play calling. Hopefully we see that this year.
so what you're saying is that I'm asking to much when I just want no INTs?
we need less INTs period. Bad INTs include a lot more than just ones taken back for score and your good INTs aren't necessarily always going to be good INTs. If the defense is gassed out and we come back out on the field and throw what you call a good INT right away it's a "bad" INT. There are so many different scenarios that could make an INT bad that I won't even try to list them all.
Assuming Brewer picks up where he left off, less INTs should be in the cards this season.
he might even throw fewer ints!
that...was awesome
To me, it seemed like a couple of the interceptions were misreading coverage and poor footwork. I would expect those to be fixed.
I'm gonna guess that he'll still have ~10 interceptions just because of his occasional inaccuracy, pressure, and aggressiveness throwing deep balls, but they shouldn't be backbreakers like last year.
No chance we are 4th in rushing in the acc without a 1000 yard rusher.
Why do you think that? NCSU was 4th last year without a 1000 yard rusher. There were 5 1000 yard RBs last year in the ACC. 2 of them were on teams not in the top 5 of total rushing.
I just think that in order for vt to be that good rushing, we need a dominant back. We can't rely on the o line to open up gaping holes for whoever the back in at that drive.
I think, and hope, you are wrong. I think a lot of Brewer's limitations last year were due to a combination of not knowing the offense thoroughly and having good but not great rapport with his leading receivers. I expect a great deal of improvement in his play as a result of game experience, film study, and practice time. (I also thought he played injured a LOT last year, and I hope better health will lead to better play, too. But I may be wrong about that -- there were very few public comments about his health last year.)
Yeah, he was pretty banged up last year. Something about during halftime of the Pitt game, he couldn't feel his arm. But I also don't expect that will subside either. His gunslinger'ness also means he gets rid of balls very late, takes some hits trying to extend plays.....in general: puts himself in danger a lot.
I'm expecting Motley to be an important player this year (unless they push Lawson ahead of him on the depth chart). I would set the O/U on the # of games Brewer starts at 10.
Ive seen a lot of positives about our line and a lot of so-so 'may be the same as last year' comments about our line.
How do you simulate your odds of winning? Just with team rankings? 98% on the road vs Purdue is way too close to 100% for a p5 matchup, especially a team that is not dominant like us. I'd expect a game like Furman to be 98%, if that
Several of the computer ranking systems out there (Massey and whatifsports are a couple that I'm familiar with) include odds of winning as part of their rankings. I suspect this is where that data might come from.
Massey is the one I'm most familiar with. It has us at 79% which I think is pretty on the money. I'd just have to imagine if several ranking systems are used in aggregate and we ended up at 98% then a system or two has us at 99% or over. Which is absurd and I assume must be some kind of error
I don't know if I'd call it an error...I'm sure they are working as intended. Probably more an issue of limited information for preseason rankings that will shake out somewhat quickly. I use the Superlist site to pull the percentages, which only has 3 computers to go off of currently...one of them doesn't make clear how the ratings get converted to a score difference and the other has us 24 points better. the one without the clear conversion to points, however, has Purdue ranked 103rd in the country so I'm sure it has very high probability of a win. In any event these will get updated as we go.
The weird thing for me with Massey is that he always seems to have some of the lowest rating of VT so there's something about his algorithm that doesn't like our style of football. Ironically Massey is a VT alum.
I'd bet the reason is because VT doesn't have great win margins against lesser teams.
Either way, I took a look the other two sites as well. You're right not much info there. Are the three weighted equally? Because then 98% would be impossible with one system giving us 79%. Just a little confused on the actual numbers there.
I see the superlist has us winning by 31. That's odd with Massey having us win by 12 and the other one by 24. Very odd
Superlist is combining them (http://wilson.engr.wisc.edu/superlist/) into ratings that can be converted into a predicted score difference. They currently have VT at 67.833 and Purdue at -1.333. To calculate score difference you dive the difference between two teams by 2 and then give the home team 3 points. This results in a predicted margin of about 31.5, and teams projected to win by 31.5 win 98% of the time.
Basically it is combining the predicted score difference between the three sites and not the predicted odds of winning, and I am using historical data to convert that predicted score difference into odds of winning. So the third site must project us to win by 40 something. It appears to be accurate for other games (for example, we are projected as 12-point underdogs to Ohio State) so I'm not worried that their code is wrong and rather just see this as an artifact of preseason rankings not being particularly stable.
Part way through the season, as they are available, it will begin incorporating other systems as well although I think the biggest factor here is just instability and not a lack of computers.
That's just bizarre that a model would peg us at that win margin. Just about any way you cut the data, I don't see how they could get it that high. Oh well
One more note...keep in mind the individual sites have already incorporated the home field advantage. so Massey has us as 15 points better and the other one as 27 points better. Still that leaves the third as having a much larger rating difference, but it's an important adjustment either way.
Massey has a number of different procedures to formulate his rating; I don't recall which of the several he's developed he uses for the "official" one. I did a presentation for my Master's degree that discussed a number of different rating schema that took different linear algebra-based approaches to ranking teams; Massey's original system, developed for his undergraduate honors project at Bluefield College, was one of those systems.
The main driver of his simple linear algebra system is score differential - and, as I think someone else pointed out, the fact that VT tends not to overwhelm the scoreboard when facing lesser foes, VT tends to lose out in the "simple" Massey scheme. He has a more complicated method that relies on a way of "scoring" offensive and defensive capabilities, but I didn't review that one for my project.
I don't know that I'd necessarily agree that it's "ironic" that Massey is a VT alum - to my knowledge, he's made pretty big money (for the field) doing this type of athletic analytics, so it would obviously behoove him to maintain a system that is mathematically justifiable rather than engineer it to drive particular preferences.
For what it's worth, though, I did find that the Massey system tended to yield results that were often inconsistent with other systems that didn't rely on score differential. Also, the NCAA actually proscribed the use of score differential, at least up to a certain point, in computer algorithms that underlie the BCS ratings. So Massey's system provides another interesting data point - but its utility may well be limited. It would be interesting to experiment with his ratings by explicitly capping score differential (e.g. winning by 100 is functionally no different than winning by 20) to see what that does to things...
Awesome thoughts - thanks for sharing. I believe the ones posted to his site are the more complicated ones but I don't know for sure.
But since you kicked that soapbox my way I'll offer a little rant. Early in the BCS days, there was no limitation on what information the computers could use. Because they made the ratings more accurate, of course they took into account score difference because winning by 20 does mean something different than winning by 1. But then they noticed the computers disagreeing with polls, and -shocker here - took that to mean there was something wrong with the computers and not the polls! The point of the computers was to provide an element of the formula not subject to human bias...when that was shown to be working, they immediately decided that something must change.
So the system was changed to where computers could not take score difference into account, and only counted towards 1/3 of the BCS formula. Basically they tried to make the computers agree with the humans, which defeats the entire purpose of including computers.
In any event, as multiple people have done, the computer systems have all been compared for accuracy in predicting results. And surprise, the ones that include score difference are far more accurate than those that don't. One argument that was made with the change is that including the score difference encourages teams to run up the score. That is absurd for a few reasons:
1. The humans do that very thing, frequently citing the score difference between two teams as evidence of why their rankings are accurate.
2. Given the complexity of some of the rating systems, applying diminishing returns is a very simple task. You simply make higher and higher score differentials worst progressively less until scoring more essentially has no impact.
3. Before computers mattered, pollsters were using this information and very regularly teams with a large lead killed clock and/or played second string players, giving evidence that even in a system where this matters and not just winning and losing teams don't run up the score more than they feel necessary to ensure a comfortable win.
Well, thanks for the soap box...would you like it back now?
Thanksfor continuing an interesting discussion! First, I need to comment that since the project was essentially a capstone exercise for my Master's degree, I was much more concerned with the mathematics and less concerned with the history of the BCS utilization of the methodologies. The four distinct methods I considered all centrally tried to reduce the problem of competitive pairwise rankings to as simple a procedure as possible, so as to make the results mathematically obvious and also so as to limit the variability of results based on parametric inputs that take a lot of work to refine (how much is home-field advantage worth, anyway?)
I think you've identified the central problem with what the BCS tried to do, which was essentially justify additional credibility from the human polls by showing that computers could/would come up with the same answer. The developers of the models, by the way, tend to use a comparison of their method's results to previous seasons' human polls to determine whether they've got a good method or not. The obvious circularity is a problem when coming up with an evaluation methodology, because there isn't an objective standard by which to judge which team is "best" and which is worst.
Remember, too, that each of these methods were originally developed as an ex post facto look at season results - meaning that they are intended to be used at the end of the season to see, in hindsight and based on some simple input data, which teams were the best ones (some of the methods lose stability in the "middle" of the pack). As predictive tools, they aren't necessarily useful because you have to know the results of previous games. I tried to do a simple extension with NCAA basketball to see if I could diving some kind of "momentum" calculation by assuming that more recent games are more important indicators of immediate success - my conclusion was that "it can be done" but the question of what the relationship ought to be (linear? quadratic? exponential? logrithmic? and what about the parameters?) is still "to be evaluated" and is quite honestly a lot more work than I intended to do for a Master's presentation.
I think that it's ultimately folly to try to engineer a computer system to provide near-identical results to human polls for a few reasons. One is that computers are not "impressed" by wide-margin wins - nor are they particularly impressed with last-second upsets. I approached the problem by considering what might happen if we considered, say, a final score margin of -3 to +3 to be effectively a tie...never got to execute the methodology on that, but I think it'd be interesting to do. Another is that human pollsters, I think, tend to be implicitly biased towards their original ranking until conclusive evidence is offered to them that they were wrong. It'd be interesting to do some analysis on, say, the tendency of preseason-ranked teams to remain ranked when compared with other "similar record" teams that started the season unranked, or ranked lower. I suspect that we'd find that the pre-season #1 tends to receive more of the benefit of the doubt than the pre-season #50...but that's just a guess on my part.
At any rate, the point of all this is that ranking methodologies are an interesting question that I continue to talk about in my "free" time. If you have a few minutes, I'd recommend reading through a method developed by Peter Mucha (he's in the mathematics department at UNC, I think) that essentially uses a system of linear ODEs to emulate automated voting behavior - it's a different perspective that I hadn't really though of until I read his paper. I can try to dig up the link if you want.
I agree 98% feels too high...unfortunately there are few computer ratings out there that (a) do preseason ratings and (b) convert them to a projected score difference. So at the moment this is using three computers that are not particularly high on Purdue, even by Purdue standards. They project a score difference in the high 20's.
That said, Purdue finished last season poorly and most preseason ratings start with how you finished the previous year. So I suspect that 98% will come down once a game or two has been played and will likely end up somewhere in the 80's or low 90's. Conversely, although I think Georgia Tech will be very good this year, I see our odds of winning that coming up as a couple of games get played.
The good news is that those graphs will be getting updated as the season progresses and included in each game's statistical preview!
Mid 80s would be the most plausible to me for Purdue. GT though is definitely too low. But I totally understand why the numbers would be that low. GT-VT is going to be a coin flip game regardless of location.
Is it possible that some of the data pulled for "week 2" Purdue was accidentally pulled from week 2 Furman?
See my explanation above...basically it is correctly pulling Purdue but preseason computers are always going to be a little wacky. The teams are pulled by name and not as "Week 2".
I'd be curious to see the last chart (odds of X wins) for LOLUVA. How hard would it be to throw that one together for comparison sake? Queue histogram uvafail jokes...
Can we also get one showing how great mike London is at using timeouts
I would love to do this...let me try to find the time.
Looking forward to it!
Absolutely agree with your opinion on Ford becoming a 1000 yd receiver. Brewer has a lot of good qualities, but he does not have enough confidence in his deep ball. He won;t even try it much this year.
17% chance LOLUVA beats us...maybe using NCAA 2003! See what I did there!
You have assumed Shai and Mars are returning, but there is a reasonable amount of speculation on redshirts for one or both. Would most other models that take into account returning players make this assumption, and how would you expect things to change, statistically, if it was assumed one or both would not play? (From a math guy without much background in statistics.)
Most don't share their exact method to that level of detail, but generally speaking a Virginia Tech fan is going to base their prediction on much more information than a computer (but usually not more accurately because that is counter-weighted by irrational emotions). So I would think that in the case of Shai and Marshawn it basically says VT is returning 38% of production to the RB position (I made up that number by the way). I doubt they are constantly updated with redshirt info. They are making their best guess.
So happy there were summaries for these graphs. This took me back to Econ class. Great information though, thanks for getting this together Joel.
Days....
21,272 days? But I can't wait that longgggggg
Joel is back be crunching numbers?! Damn I can hear football right around the corner!!!!!
Wonder how much these simulations take into account the coaching? Dave Bartoo's site cfbmatrix.com has his coaching effect and anti-coaching effect ratings. Beamer got the Charlie Weis Anti-Coach Effect of the Year last year for the ACC with a -4 rating. That means we lost 4 games more than we should have to inferior talented teams. The page is here.
However, Bartoo does believe the Hokies have a good shot at winning at least 2 more games this year than last.
They take into account win expectation which would inherently include any common factor that goes into that whether it is talent, coaching, luck, etc. Dave's site doesn't really spell out how he compares talent between two teams so it's hard to say whether there really is a negative Frank Beamer effect or not.
I simulated the games on NCAA 2016 and .... oh yea never mind. I'm ready for games to start so I can quit thinking about all the what ifs. Good article and I'll go with the 0.43% chance we go undefeated.
Yeah, I also can't wait until somebody makes another college football game, once the NCAA gets a handle on how the licensing agreements would need to work with players.
And yeah, I'd totally take those odds. If only Vegas would give me 232:1 on us going 12-0...
I disagree with the comment saying we have a 56% chance of an 8 or 9 win season. That's simply inaccurate reading of the graph. To get an actual % chance of # of games won, add up the column above the number in question with every column to the right.
For example:
Odds VT wins at least 8 games = 76.67%
Odds VT wins at least 9 games = 49.37%
Odds VT wins at least 10 games = 20.77%
Not inaccurate if the statement is "chance of an 8 or 9 win season." You're correct for the "at least 8, 9, or 10 win" scenarios, but for the possibility of an 8 or 9 win, add percentage of 8 win and percentage of 9 win, and that's the likelihood of one of those two happening.
you're partially right, it should be a 55.9% chance. Gosh