
Here's a pretty interesting graphic depicting how schools make use of their recruiting classes. You can read the original post at Chart: Which NCAA Football Teams Outplay Their Recruit Rankings? or SBNation's take
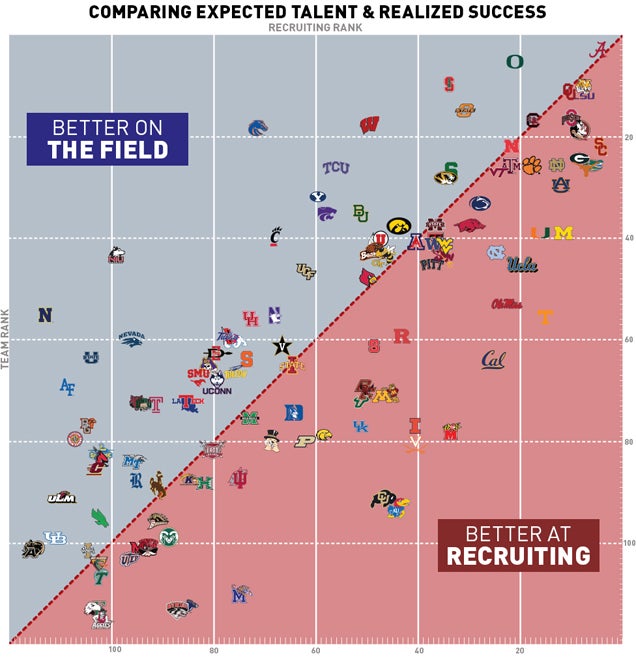
The chart plots out "on-field success" vs recruiting rankings from 2009-2013. The on-field succes was based on a composite index that "averages dozens of rankings including the six computers used in the BCS." The recruiting is from Rivals.com, using the class ranking instead of the average stars. I think it would've been more accurate to use the stars personally since the gaps between the rankings aren't necessarily linear. VT was 22nd overall here, even though our average was 24.4 (only 0.8 std dev for you numbers lovers!).
Our beloved Hokies do a good job with getting the expected results from our recruiting classes, just a hair on the underperforming side of the line. Which actually surprised me since we typically feel that our coaching staff does more with less, so to speak.
Make sure to laugh at our Hoo friends when you find them! (hint: the farther down and to the right you are the more you should be ashamed of yourselves)
Comments
Please join The Key Players Club to read or post comments.
Please join The Key Players Club to read or post comments.
Please join The Key Players Club to read or post comments.
Please join The Key Players Club to read or post comments.
Please join The Key Players Club to read or post comments.
Please join The Key Players Club to read or post comments.
Please join The Key Players Club to read or post comments.
Please join The Key Players Club to read or post comments.
Please join The Key Players Club to read or post comments.
Please join The Key Players Club to read or post comments.
Please join The Key Players Club to read or post comments.